我们知道一些游戏为了防止被分析会加入反调试的代码,那么我们的木马样本同样也需要用到反调试技术。攻和防其实是相对的,只有了解了调试的原理,才能更深入的进行对抗,本文就对一些常见的反调试手段进行总结并对深层原理进行探究。
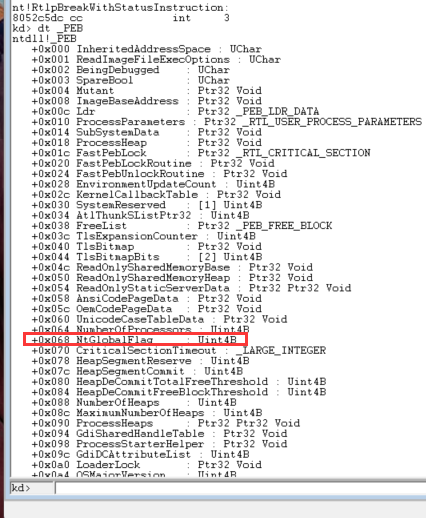
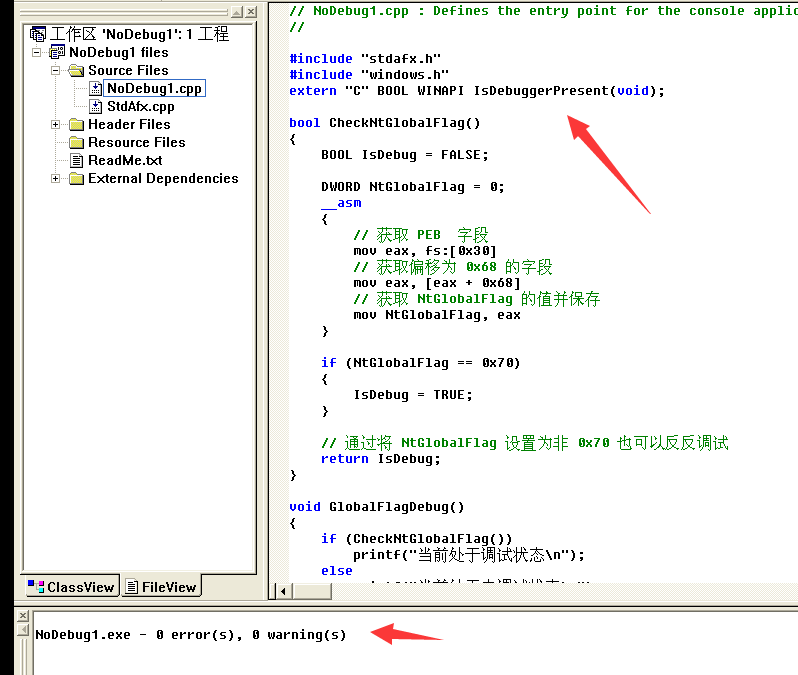
调用API NtGlobalFlag 在 32 位机器上,NtGlobalFlag字段位于PEB的0x68的偏移处,64 位机器则是在偏移0xBC位置,该字段的默认值为 0。当调试器正在运行时,该字段会被设置为一个特定的值
该字段包含有一系列的标志位,由调试器创建的进程会设置以下标志位:
1
2
3
FLG_HEAP_ENABLE_TAIL_CHECK (0x10 )FLG_HEAP_ENABLE_FREE_CHECK (0x20 )FLG_HEAP_VALIDATE_PARAMETERS (0x40 )
这里NtGlobalFlag的汇编代码如下,如果返回值为0x70则程序处于调试状态
1
2
3
4
5
mov eax, fs:[30 h] ;Process Environment Block mov al, [eax+68 h] ;NtGlobalFlag and al, 70 hcmp al, 70 h je being_debugged
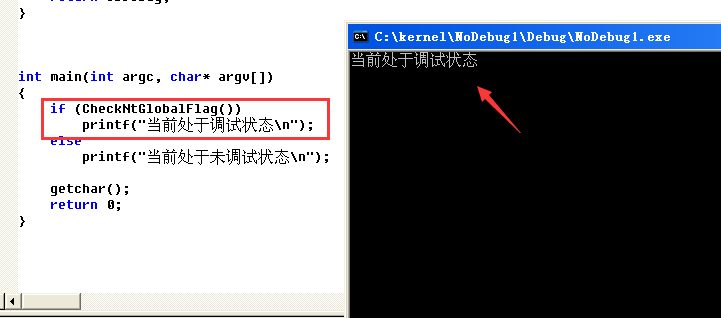
那么可以用代码进行判断如下,若返回为TRUE则处于调试状态,若返回FALSE则未处于调试状态
1
2
3
4
5
6
7
8
9
10
11
12
13
14
15
16
17
18
19
bool CheckNtGlobalFlag () BOOL IsDebug = FALSE; DWORD NtGlobalFlag = 0 ; __asm { mov eax, fs:[0x30 ] mov eax, [eax + 0x68 ] mov NtGlobalFlag, eax } if (NtGlobalFlag == 0x70 ) { IsDebug = TRUE; } return IsDebug; }
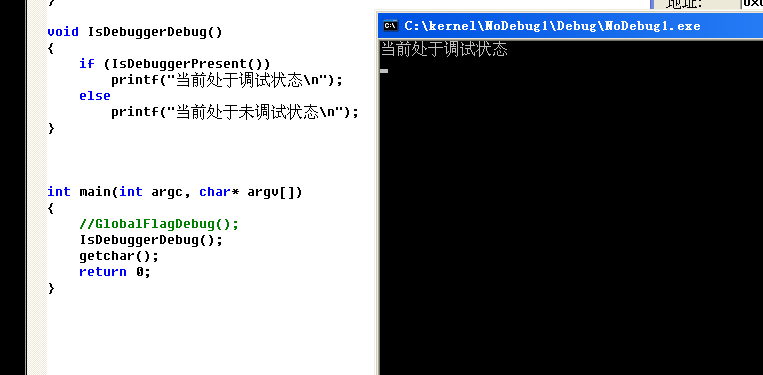
这里直接用编译器打开,处于调试状态
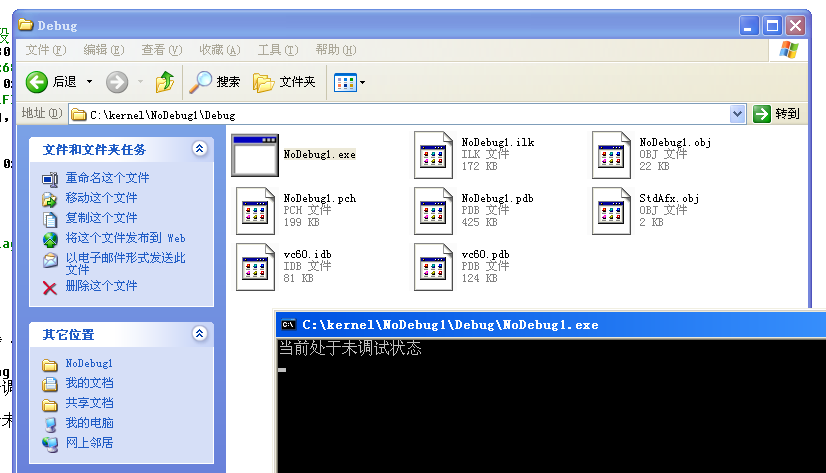
正常打开则处于未调试状态
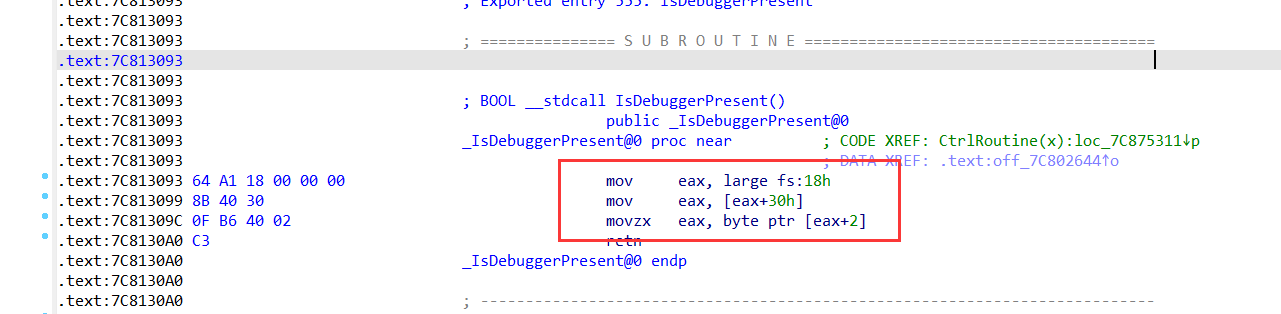
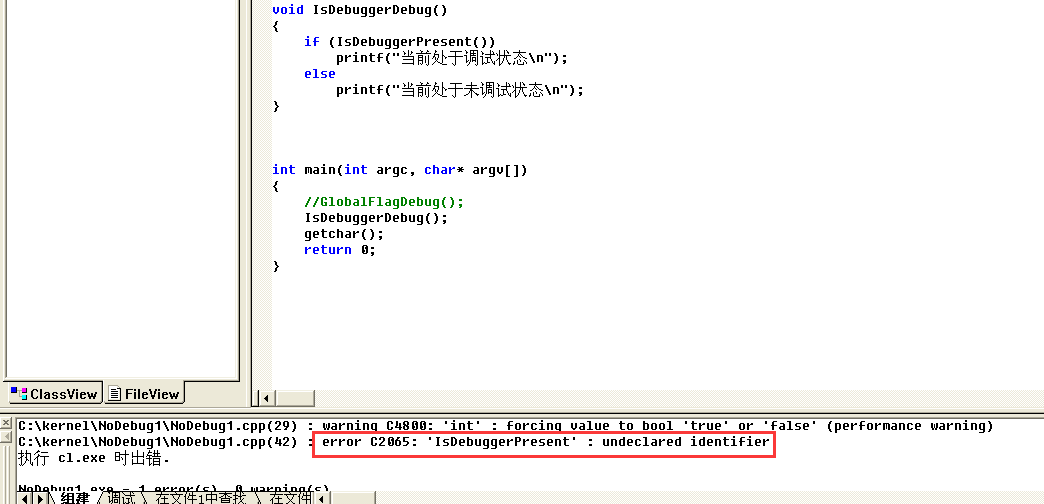
IsDebuggerPresent IsDebuggerPresent这个API位于kernel32.dll里面,首先通过0x18偏移找到TEB,再通过0x30找到PEB
然后在PEB的0x2偏移找到BeingDebugged,这个值用来存储是否处于调试状态,PEB结构如下
1
2
3
4
5
6
7
8
9
10
11
12
13
14
15
16
17
18
19
20
21
22
23
24
25
26
27
28
29
30
31
32
33
34
35
36
37
38
39
40
41
42
43
44
45
46
47
48
49
50
51
52
53
54
55
56
57
58
59
60
61
62
63
64
65
66
67
68
69
70
71
72
73
74
75
76
77
78
79
80
81
82
83
84
85
86
87
88
89
90
91
92
93
94
95
96
97
98
99
100
101
102
103
104
105
106
107
108
109
110
111
112
113
114
115
116
0 :023 > dt ntdll!_PEB +0x000 InheritedAddressSpace : UChar +0x001 ReadImageFileExecOptions : UChar +0x002 BeingDebugged : UChar +0x003 BitField : UChar +0x003 ImageUsesLargePages : Pos 0 , 1 Bit +0x003 IsProtectedProcess : Pos 1 , 1 Bit +0x003 IsImageDynamicallyRelocated : Pos 2 , 1 Bit +0x003 SkipPatchingUser32Forwarders : Pos 3 , 1 Bit +0x003 IsPackagedProcess : Pos 4 , 1 Bit +0x003 IsAppContainer : Pos 5 , 1 Bit +0x003 IsProtectedProcessLight : Pos 6 , 1 Bit +0x003 IsLongPathAwareProcess : Pos 7 , 1 Bit +0x004 Padding0 : [4 ] UChar +0x008 Mutant : Ptr64 Void +0x010 ImageBaseAddress : Ptr64 Void +0x018 Ldr : Ptr64 _PEB_LDR_DATA +0x020 ProcessParameters : Ptr64 _RTL_USER_PROCESS_PARAMETERS +0x028 SubSystemData : Ptr64 Void +0x030 ProcessHeap : Ptr64 Void +0x038 FastPebLock : Ptr64 _RTL_CRITICAL_SECTION +0x040 AtlThunkSListPtr : Ptr64 _SLIST_HEADER +0x048 IFEOKey : Ptr64 Void +0x050 CrossProcessFlags : Uint4B +0x050 ProcessInJob : Pos 0 , 1 Bit +0x050 ProcessInitializing : Pos 1 , 1 Bit +0x050 ProcessUsingVEH : Pos 2 , 1 Bit +0x050 ProcessUsingVCH : Pos 3 , 1 Bit +0x050 ProcessUsingFTH : Pos 4 , 1 Bit +0x050 ProcessPreviouslyThrottled : Pos 5 , 1 Bit +0x050 ProcessCurrentlyThrottled : Pos 6 , 1 Bit +0x050 ProcessImagesHotPatched : Pos 7 , 1 Bit +0x050 ReservedBits0 : Pos 8 , 24 Bits +0x054 Padding1 : [4 ] UChar +0x058 KernelCallbackTable : Ptr64 Void +0x058 UserSharedInfoPtr : Ptr64 Void +0x060 SystemReserved : Uint4B +0x064 AtlThunkSListPtr32 : Uint4B +0x068 ApiSetMap : Ptr64 Void +0x070 TlsExpansionCounter : Uint4B +0x074 Padding2 : [4 ] UChar +0x078 TlsBitmap : Ptr64 Void +0x080 TlsBitmapBits : [2 ] Uint4B +0x088 ReadOnlySharedMemoryBase : Ptr64 Void +0x090 SharedData : Ptr64 Void +0x098 ReadOnlyStaticServerData : Ptr64 Ptr64 Void +0x0a0 AnsiCodePageData : Ptr64 Void +0x0a8 OemCodePageData : Ptr64 Void +0x0b0 UnicodeCaseTableData : Ptr64 Void +0x0b8 NumberOfProcessors : Uint4B +0x0bc NtGlobalFlag : Uint4B +0x0c0 CriticalSectionTimeout : _LARGE_INTEGER +0x0c8 HeapSegmentReserve : Uint8B +0x0d0 HeapSegmentCommit : Uint8B +0x0d8 HeapDeCommitTotalFreeThreshold : Uint8B +0x0e0 HeapDeCommitFreeBlockThreshold : Uint8B +0x0e8 NumberOfHeaps : Uint4B +0x0ec MaximumNumberOfHeaps : Uint4B +0x0f0 ProcessHeaps : Ptr64 Ptr64 Void +0x0f8 GdiSharedHandleTable : Ptr64 Void +0x100 ProcessStarterHelper : Ptr64 Void +0x108 GdiDCAttributeList : Uint4B +0x10c Padding3 : [4 ] UChar +0x110 LoaderLock : Ptr64 _RTL_CRITICAL_SECTION +0x118 OSMajorVersion : Uint4B +0x11c OSMinorVersion : Uint4B +0x120 OSBuildNumber : Uint2B +0x122 OSCSDVersion : Uint2B +0x124 OSPlatformId : Uint4B +0x128 ImageSubsystem : Uint4B +0x12c ImageSubsystemMajorVersion : Uint4B +0x130 ImageSubsystemMinorVersion : Uint4B +0x134 Padding4 : [4 ] UChar +0x138 ActiveProcessAffinityMask : Uint8B +0x140 GdiHandleBuffer : [60 ] Uint4B +0x230 PostProcessInitRoutine : Ptr64 void +0x238 TlsExpansionBitmap : Ptr64 Void +0x240 TlsExpansionBitmapBits : [32 ] Uint4B +0x2c0 SessionId : Uint4B +0x2c4 Padding5 : [4 ] UChar +0x2c8 AppCompatFlags : _ULARGE_INTEGER +0x2d0 AppCompatFlagsUser : _ULARGE_INTEGER +0x2d8 pShimData : Ptr64 Void +0x2e0 AppCompatInfo : Ptr64 Void +0x2e8 CSDVersion : _UNICODE_STRING +0x2f8 ActivationContextData : Ptr64 _ACTIVATION_CONTEXT_DATA +0x300 ProcessAssemblyStorageMap : Ptr64 _ASSEMBLY_STORAGE_MAP +0x308 SystemDefaultActivationContextData : Ptr64 _ACTIVATION_CONTEXT_DATA +0x310 SystemAssemblyStorageMap : Ptr64 _ASSEMBLY_STORAGE_MAP +0x318 MinimumStackCommit : Uint8B +0x320 SparePointers : [4 ] Ptr64 Void +0x340 SpareUlongs : [5 ] Uint4B +0x358 WerRegistrationData : Ptr64 Void +0x360 WerShipAssertPtr : Ptr64 Void +0x368 pUnused : Ptr64 Void +0x370 pImageHeaderHash : Ptr64 Void +0x378 TracingFlags : Uint4B +0x378 HeapTracingEnabled : Pos 0 , 1 Bit +0x378 CritSecTracingEnabled : Pos 1 , 1 Bit +0x378 LibLoaderTracingEnabled : Pos 2 , 1 Bit +0x378 SpareTracingBits : Pos 3 , 29 Bits +0x37c Padding6 : [4 ] UChar +0x380 CsrServerReadOnlySharedMemoryBase : Uint8B +0x388 TppWorkerpListLock : Uint8B +0x390 TppWorkerpList : _LIST_ENTRY +0x3a0 WaitOnAddressHashTable : [128 ] Ptr64 Void +0x7a0 TelemetryCoverageHeader : Ptr64 Void +0x7a8 CloudFileFlags : Uint4B +0x7ac CloudFileDiagFlags : Uint4B +0x7b0 PlaceholderCompatibilityMode : Char +0x7b1 PlaceholderCompatibilityModeReserved : [7 ] Char +0x7b8 LeapSecondData : Ptr64 _LEAP_SECOND_DATA +0x7c0 LeapSecondFlags : Uint4B +0x7c0 SixtySecondEnabled : Pos 0 , 1 Bit +0x7c0 Reserved : Pos 1 , 31 Bits +0x7c4 NtGlobalFlag2 : Uint4B
这里如果用vc6的话会提示没有这个API
需要自己定义这个API
直接运行处于调试状态
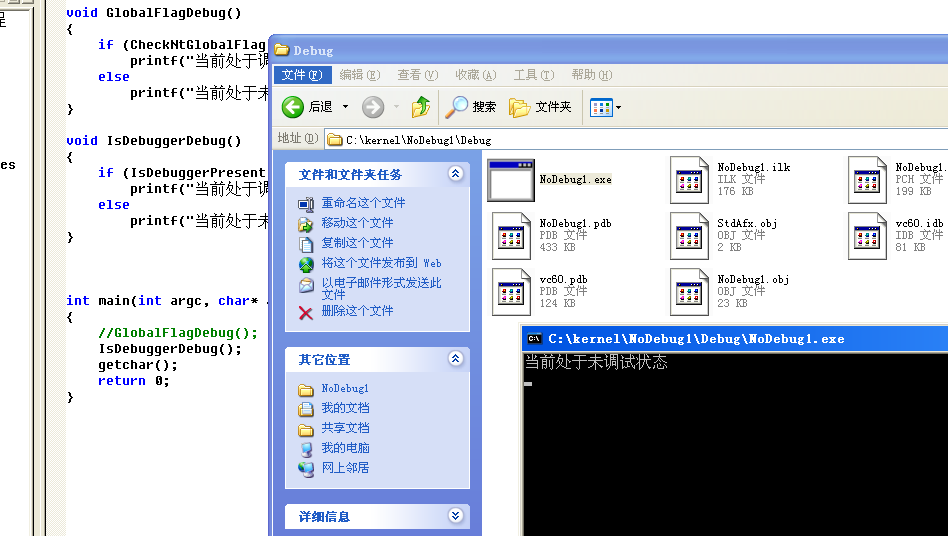
直接运行则不会显示处于调试状态
NtQueryInformationProcess 是微软未公开的一个API,目前只能够通过一些结构的名字和逆向的方式来推断用途
1 2 3 4 5 6 7 8 9 10 11 12 13 14 15 16 17 18 19 20 21 22 23 24 25 26 27 28 29 30 31 32 33 34 35 36 37 38 39 40 41 42 43 44 45 46 47 48 49 50 51 52 53 54 55 56 57 58 59 60 61 62 63 64 65 66 67 68 69 70 71 72 73 74 75 76 77 78 79 80 81 82 83 84 85 86 87 88 89 90 91 92 93 94 95 96 97 98 99 100 101 102 103 104 105 106 107 108 109 110 111 112 113 114 __kernel_entry NTSTATUS NtQueryInformationProcess ( IN HANDLE ProcessHandle, IN PROCESSINFOCLASS ProcessInformationClass, OUT PVOID ProcessInformation, IN ULONG ProcessInformationLength, OUT PULONG ReturnLength ) typedef enum _PROCESSINFOCLASS { ProcessBasicInformation, ProcessQuotaLimits, ProcessIoCounters, ProcessVmCounters, ProcessTimes, ProcessBasePriority, ProcessRaisePriority, ProcessDebugPort, ProcessExceptionPort, ProcessAccessToken, ProcessLdtInformation, ProcessLdtSize, ProcessDefaultHardErrorMode, ProcessIoPortHandlers, ProcessPooledUsageAndLimits, ProcessWorkingSetWatch, ProcessUserModeIOPL, ProcessEnableAlignmentFaultFixup, ProcessPriorityClass, ProcessWx86Information, ProcessHandleCount, ProcessAffinityMask, ProcessPriorityBoost, ProcessDeviceMap, ProcessSessionInformation, ProcessForegroundInformation, ProcessWow64Information, ProcessImageFileName, ProcessLUIDDeviceMapsEnabled, ProcessBreakOnTermination, ProcessDebugObjectHandle, ProcessDebugFlags, ProcessHandleTracing, ProcessIoPriority, ProcessExecuteFlags, ProcessResourceManagement, ProcessCookie, ProcessImageInformation, ProcessCycleTime, ProcessPagePriority, ProcessInstrumentationCallback, ProcessThreadStackAllocation, ProcessWorkingSetWatchEx, ProcessImageFileNameWin32, ProcessImageFileMapping, ProcessAffinityUpdateMode, ProcessMemoryAllocationMode, ProcessGroupInformation, ProcessTokenVirtualizationEnabled, ProcessConsoleHostProcess, ProcessWindowInformation, ProcessHandleInformation, ProcessMitigationPolicy, ProcessDynamicFunctionTableInformation, ProcessHandleCheckingMode, ProcessKeepAliveCount, ProcessRevokeFileHandles, ProcessWorkingSetControl, ProcessHandleTable, ProcessCheckStackExtentsMode, ProcessCommandLineInformation, ProcessProtectionInformation, ProcessMemoryExhaustion, ProcessFaultInformation, ProcessTelemetryIdInformation, ProcessCommitReleaseInformation, ProcessDefaultCpuSetsInformation, ProcessAllowedCpuSetsInformation, ProcessSubsystemProcess, ProcessJobMemoryInformation, ProcessInPrivate, ProcessRaiseUMExceptionOnInvalidHandleClose, ProcessIumChallengeResponse, ProcessChildProcessInformation, ProcessHighGraphicsPriorityInformation, ProcessSubsystemInformation, ProcessEnergyValues, ProcessActivityThrottleState, ProcessActivityThrottlePolicy, ProcessWin32kSyscallFilterInformation, ProcessDisableSystemAllowedCpuSets, ProcessWakeInformation, ProcessEnergyTrackingState, ProcessManageWritesToExecutableMemory,REDSTONE3 ProcessCaptureTrustletLiveDump, ProcessTelemetryCoverage, ProcessEnclaveInformation, ProcessEnableReadWriteVmLogging, ProcessUptimeInformation, ProcessImageSection, ProcessDebugAuthInformation, ProcessSystemResourceManagement, ProcessSequenceNumber, ProcessLoaderDetour, ProcessSecurityDomainInformation, ProcessCombineSecurityDomainsInformation, ProcessEnableLogging, ProcessLeapSecondInformation, ProcessFiberShadowStackAllocation, ProcessFreeFiberShadowStackAllocation, MaxProcessInfoClass } PROCESSINFOCLASS;
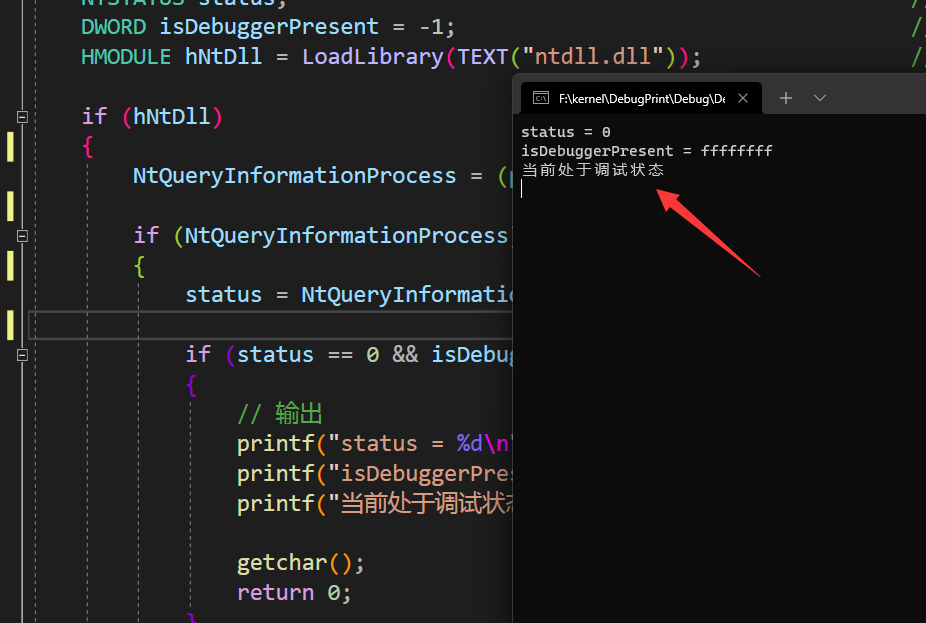
ProcessDebugPort 未公开的ntdll的NtQueryInformationProcess()函数接受一个信息类的参数用于查询。 ProcessDebugPort(7)是其中的一个信息类,kernel32的CheckRemoteDebuggerPresent()函数内部通过调用NtQueryInformationProcess()来检测调试,而NtQueryInformationProcess内部则是查询EPROCESS结构体的DebugPort字段,当进程正在被调试时,返回值为0xffffffff,实现代码如下
1
2
3
4
5
6
7
8
9
10
11
12
13
14
15
16
17
18
19
20
21
22
23
24
25
26
27
28
29
30
31
32
33
34
35
36
37
38
39
40
41
42
43
44
45
typedef NTSTATUS (NTAPI* pfnNtQueryInformationProcess) ( _In_ HANDLE ProcessHandle, _In_ UINT ProcessInformationClass, _Out_ PVOID ProcessInformation, _In_ ULONG ProcessInformationLength, _Out_opt_ PULONG ReturnLength ) bool NtQuery () pfnNtQueryInformationProcess NtQueryInformationProcess = NULL ; NTSTATUS status; DWORD isDebuggerPresent = -1 ; HMODULE hNtDll = LoadLibrary (TEXT ("ntdll.dll" )); if (hNtDll) { NtQueryInformationProcess = (pfnNtQueryInformationProcess)GetProcAddress (hNtDll, "NtQueryInformationProcess" ); if (NtQueryInformationProcess) { status = NtQueryInformationProcess (GetCurrentProcess (), ProcessDebugPort, &isDebuggerPresent, sizeof NULL ); if (status == 0 && isDebuggerPresent != 0 ) { printf ("status = %d\n" , status); printf ("isDebuggerPresent = %x\n" , isDebuggerPresent); printf ("当前处于调试状态\n" ); getchar (); return 0 ; } } } printf ("status = %d\n" , status); printf ("isDebuggerPresent = %x\n" , isDebuggerPresent); printf ("当前未处于调试状态\n" ); }
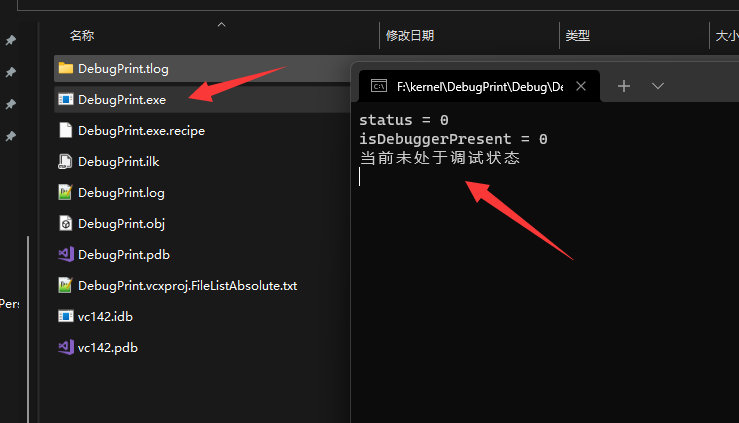
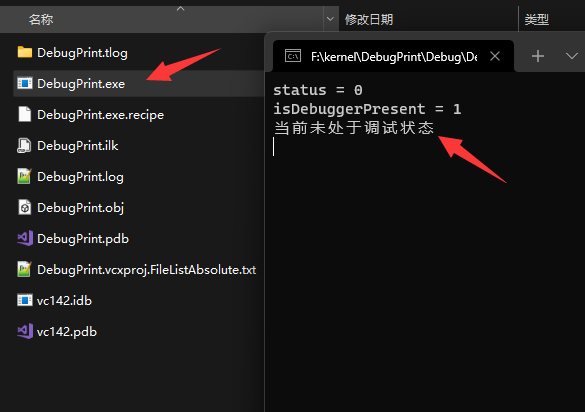
当isDebuggerPresent的值为-1的时候处于调试状态
为0的时候则为正常启动
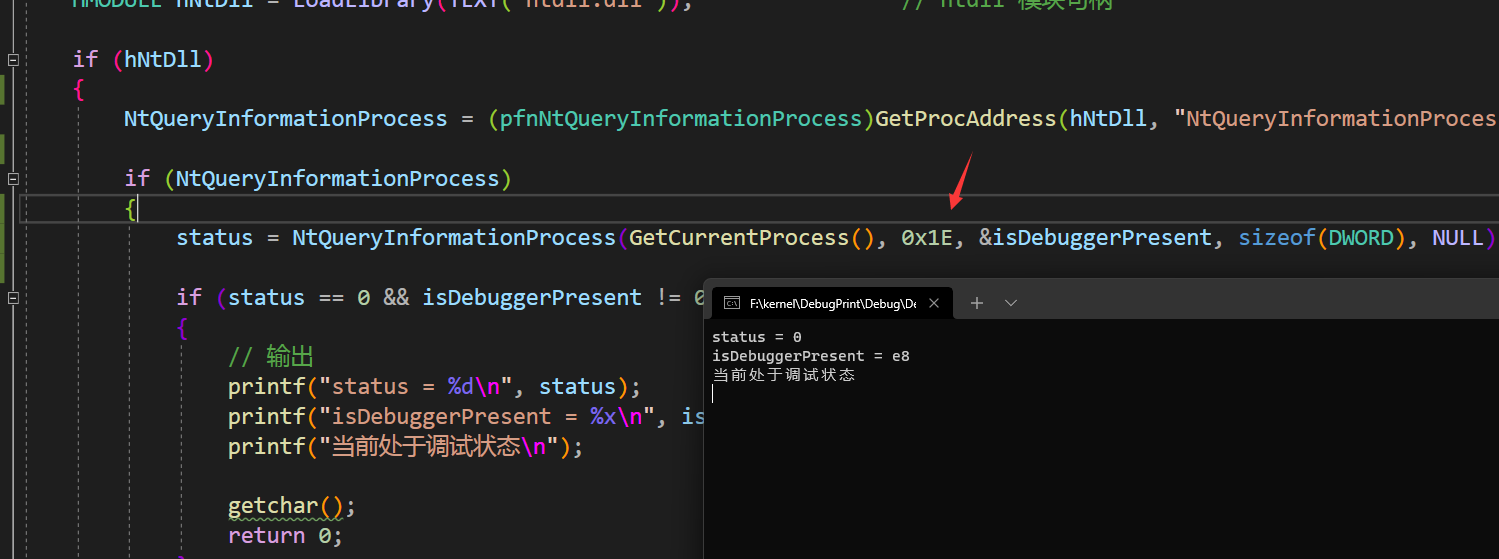
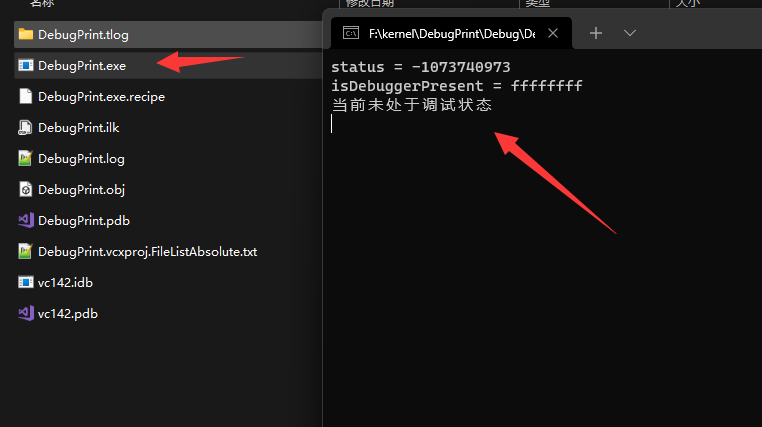
ProcessDebugObjectHandle ProcessDebugObjectHandle位于0x1E偏移,当status不为0、isDebuggerPresent不等于0时则处于调试状态
1 status = NtQueryInformationProcess (GetCurrentProcess (), 0x1E , &isDebuggerPresent, sizeof NULL );
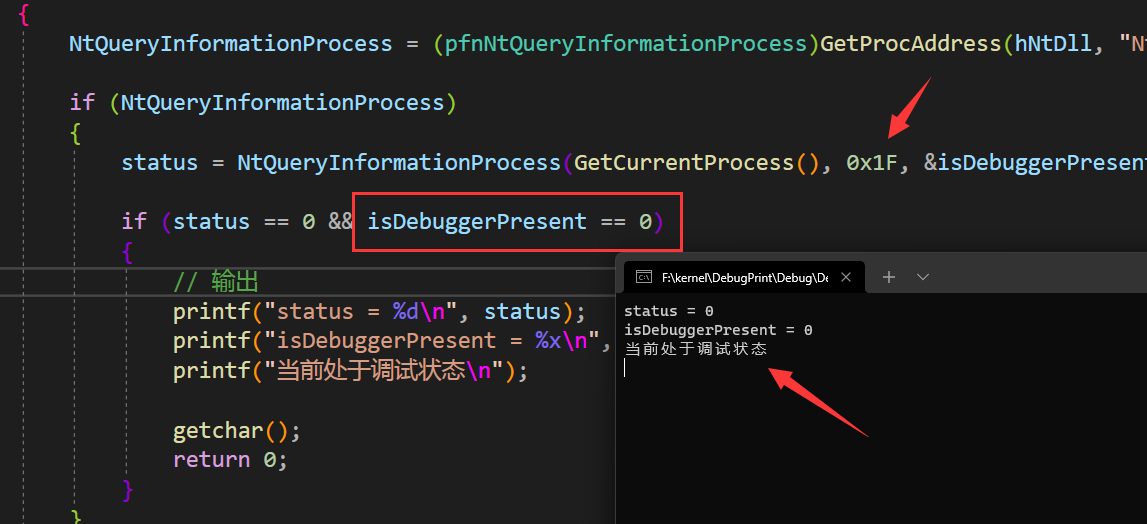
ProcessDebugFlags ProcessDebugFlags (0x1f)类返回EPROCESS结构体的NoDebugInherit的相反数,当调试器存在时,返回值为0,不存在时则返回4
1
2
3
status = NtQueryInformationProcess (GetCurrentProcess (), 0x1F , &isDebuggerPresent, sizeof NULL ); if (status == 0 && isDebuggerPresent == 0 )
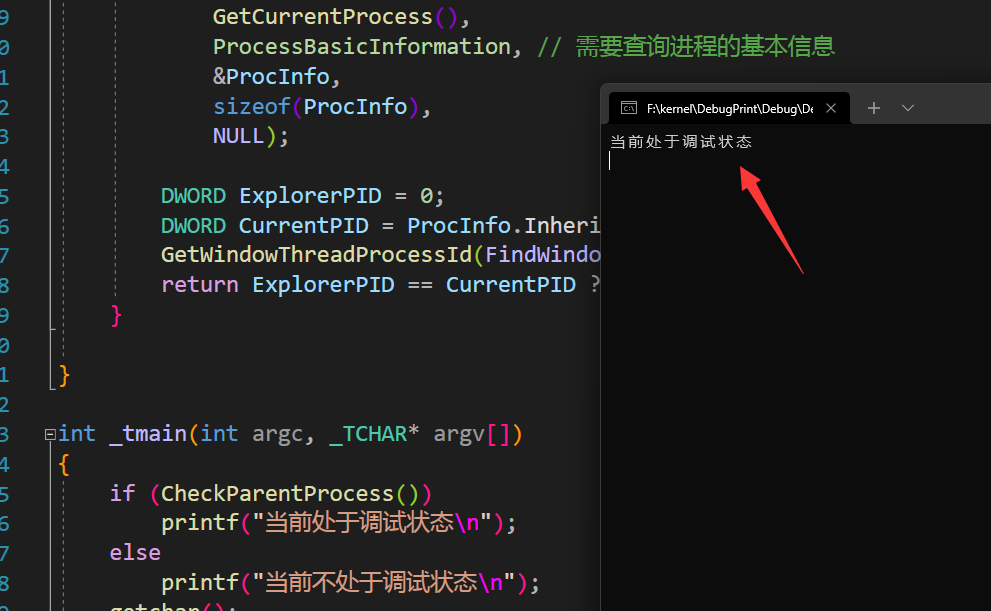
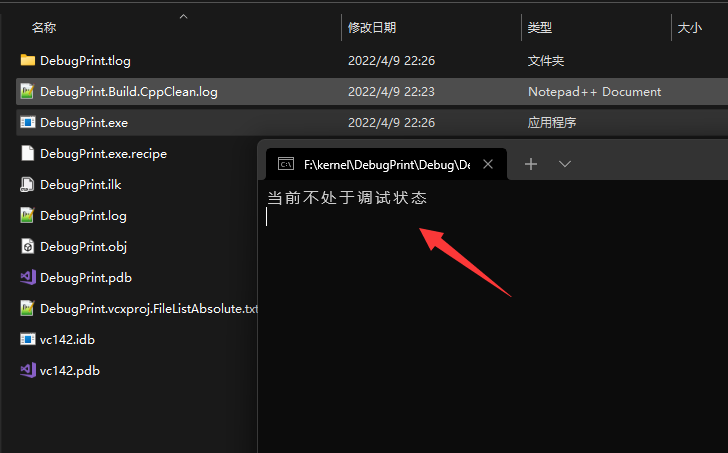
父进程 我们一般正常模式启动程序其父进程一般都是explorer.exe(不考虑服务进程),而当我们处于调试状态则父进程为调试器进程,那么我们就可以通过ntdll.dll里面的NtQueryInformationProcess来进行判断,实现代码如下
1
2
3
4
5
6
7
8
9
10
11
12
13
14
15
16
17
18
19
20
21
22
23
24
25
26
27
28
29
30
31
32
bool CheckParentProcess () pfnNtQueryInformationProcess NtQueryInformationProcess = NULL ; HMODULE hNtDll = LoadLibrary (TEXT ("ntdll.dll" )); if (hNtDll) { struct PROCESS_BASIC_INFORMATION { ULONG ExitStatus; PPEB PebBaseAddress; ULONG AffinityMask; LONG BasePriority; ULONG UniqueProcessId; ULONG InheritedFromUniqueProcessId; }ProcInfo; NtQueryInformationProcess = (pfnNtQueryInformationProcess)GetProcAddress (hNtDll, "NtQueryInformationProcess" ); NtQueryInformationProcess ( GetCurrentProcess (), ProcessBasicInformation, &ProcInfo, sizeof NULL ); DWORD ExplorerPID = 0 ; DWORD CurrentPID = ProcInfo.InheritedFromUniqueProcessId; GetWindowThreadProcessId (FindWindow (L"DebugPrint" , NULL ), &ExplorerPID); return ExplorerPID == CurrentPID ? false : true ; } }
实现效果如下
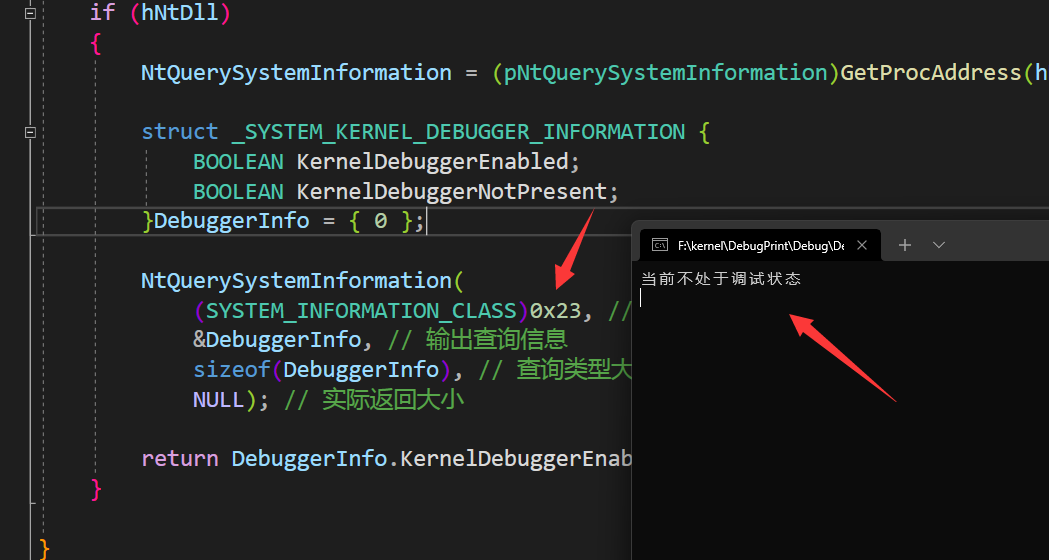
KernelDebuggerEnabled NtQuerySystemInformation 被 ntdll.dll 导出,当第一个参数传入 0x23 (SystemInterruptInformation) 时,会返回一个 SYSTEM_KERNEL_DEBUGGER_INFORMATION 结构,里面的成员KdKdDebuggerEnable 和 KdDebuggerNotPresent 标志系统是否启用内核调试
1
2
3
4
5
6
7
8
9
10
11
12
13
14
15
16
17
18
19
20
21
22
23
24
25
26
27
28
29
30
typedef struct _SYSTEM_KERNEL_DEBUGGER_INFORMATION { BOOLEAN KernelDebuggerEnabled; BOOLEAN KernelDebuggerNotPresent; } SYSTEM_KERNEL_DEBUGGER_INFORMATION, * PSYSTEM_KERNEL_DEBUGGER_INFORMATION; typedef NTSTATUS (WINAPI* pNtQuerySystemInformation) (IN UINT SystemInformationClass, OUT PVOID SystemInformation, IN ULONG SystemInformationLength, OUT PULONG ReturnLength) bool CheckSystemKernelDebuggerInformation () pNtQuerySystemInformation NtQuerySystemInformation = NULL ; HMODULE hNtDll = LoadLibrary (TEXT ("ntdll.dll" )); if (hNtDll) { NtQuerySystemInformation = (pNtQuerySystemInformation)GetProcAddress (hNtDll, "NtQuerySystemInformation" ); struct _SYSTEM_KERNEL_DEBUGGER_INFORMATION { BOOLEAN KernelDebuggerEnabled; BOOLEAN KernelDebuggerNotPresent; }DebuggerInfo = { 0 }; NtQuerySystemInformation ( (SYSTEM_INFORMATION_CLASS)0x23 , &DebuggerInfo, sizeof NULL ); return DebuggerInfo.KernelDebuggerEnabled; }
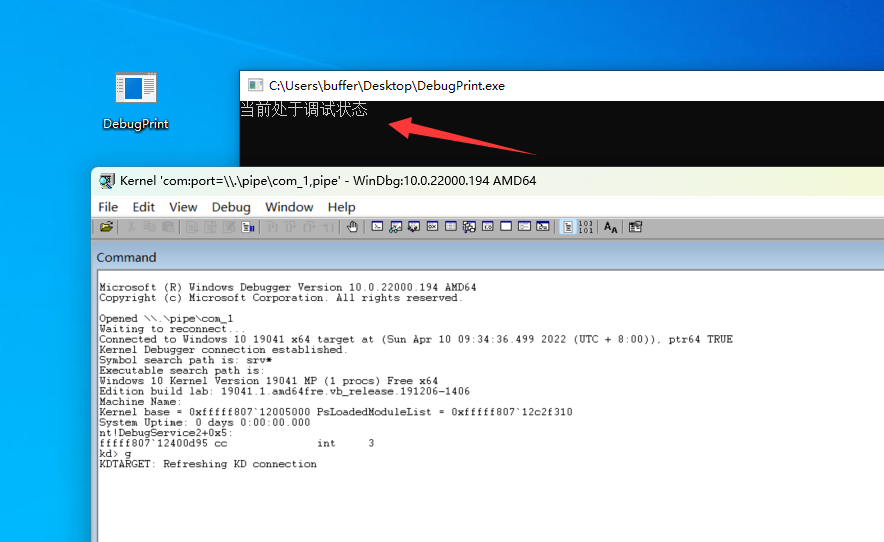
因为这里检测的是否启用内核调试,这里直接运行是不处于调试状态
使用调试模式启动win10运行则显示处于调试状态
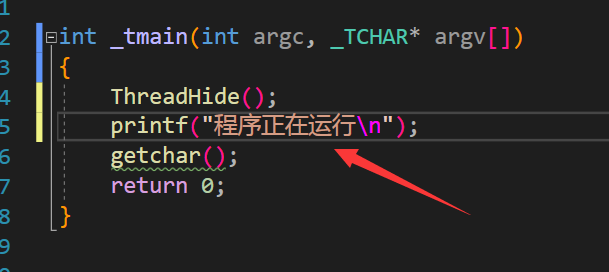
ThreadHideFromDebugger 通过ZwSetInformationThread函数,设置 ThreadHideFromDebugger 此参数将使这条线程对调试器隐藏,即调试器收不到调试信息
1
2
3
4
5
6
7
8
9
10
11
12
13
14
15
16
17
18
typedef enum THREAD_INFO_CLASS {ThreadHideFromDebugger = 17 }; typedef NTSTATUS (NTAPI* ZW_SET_INFORMATION_THREAD) ( IN HANDLE ThreadHandle, IN THREAD_INFO_CLASS ThreadInformaitonClass, IN PVOID ThreadInformation, IN ULONG ThreadInformationLength) void ZSIT_DetachDebug () ZW_SET_INFORMATION_THREAD ZwSetInformationThread; ZwSetInformationThread = (ZW_SET_INFORMATION_THREAD)GetProcAddress (LoadLibrary (L"ntdll.dll" ), "ZwSetInformationThread" ); ZwSetInformationThread (GetCurrentThread (), ThreadHideFromDebugger, NULL , NULL ); }
这里调用函数之后为了证明程序运行成功,这里加上一行输出语句
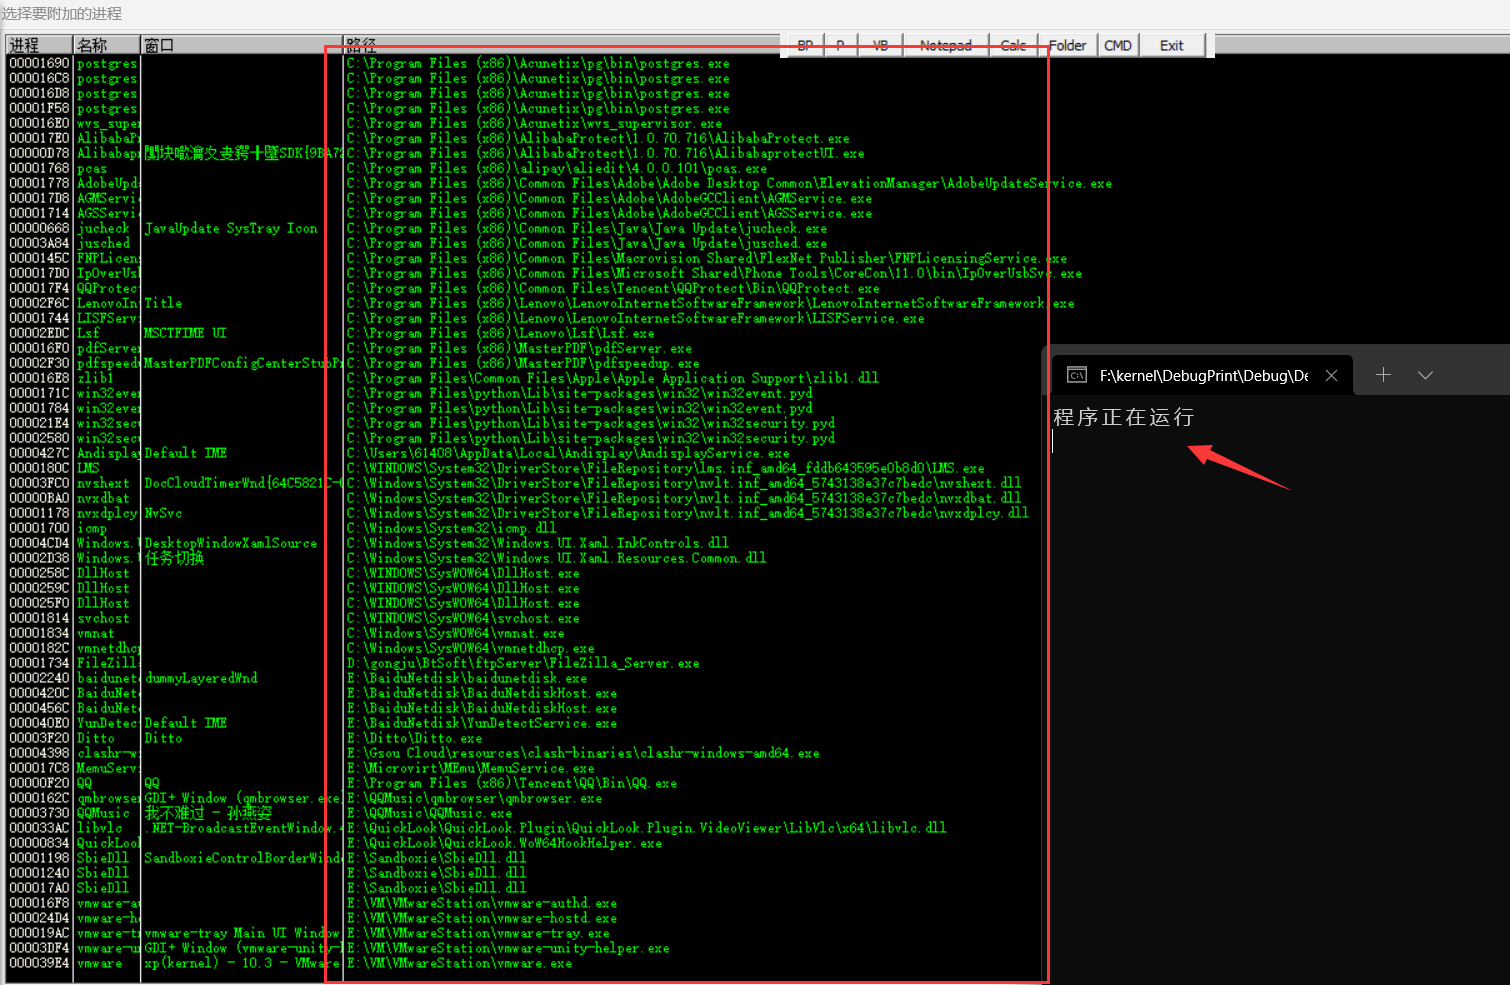
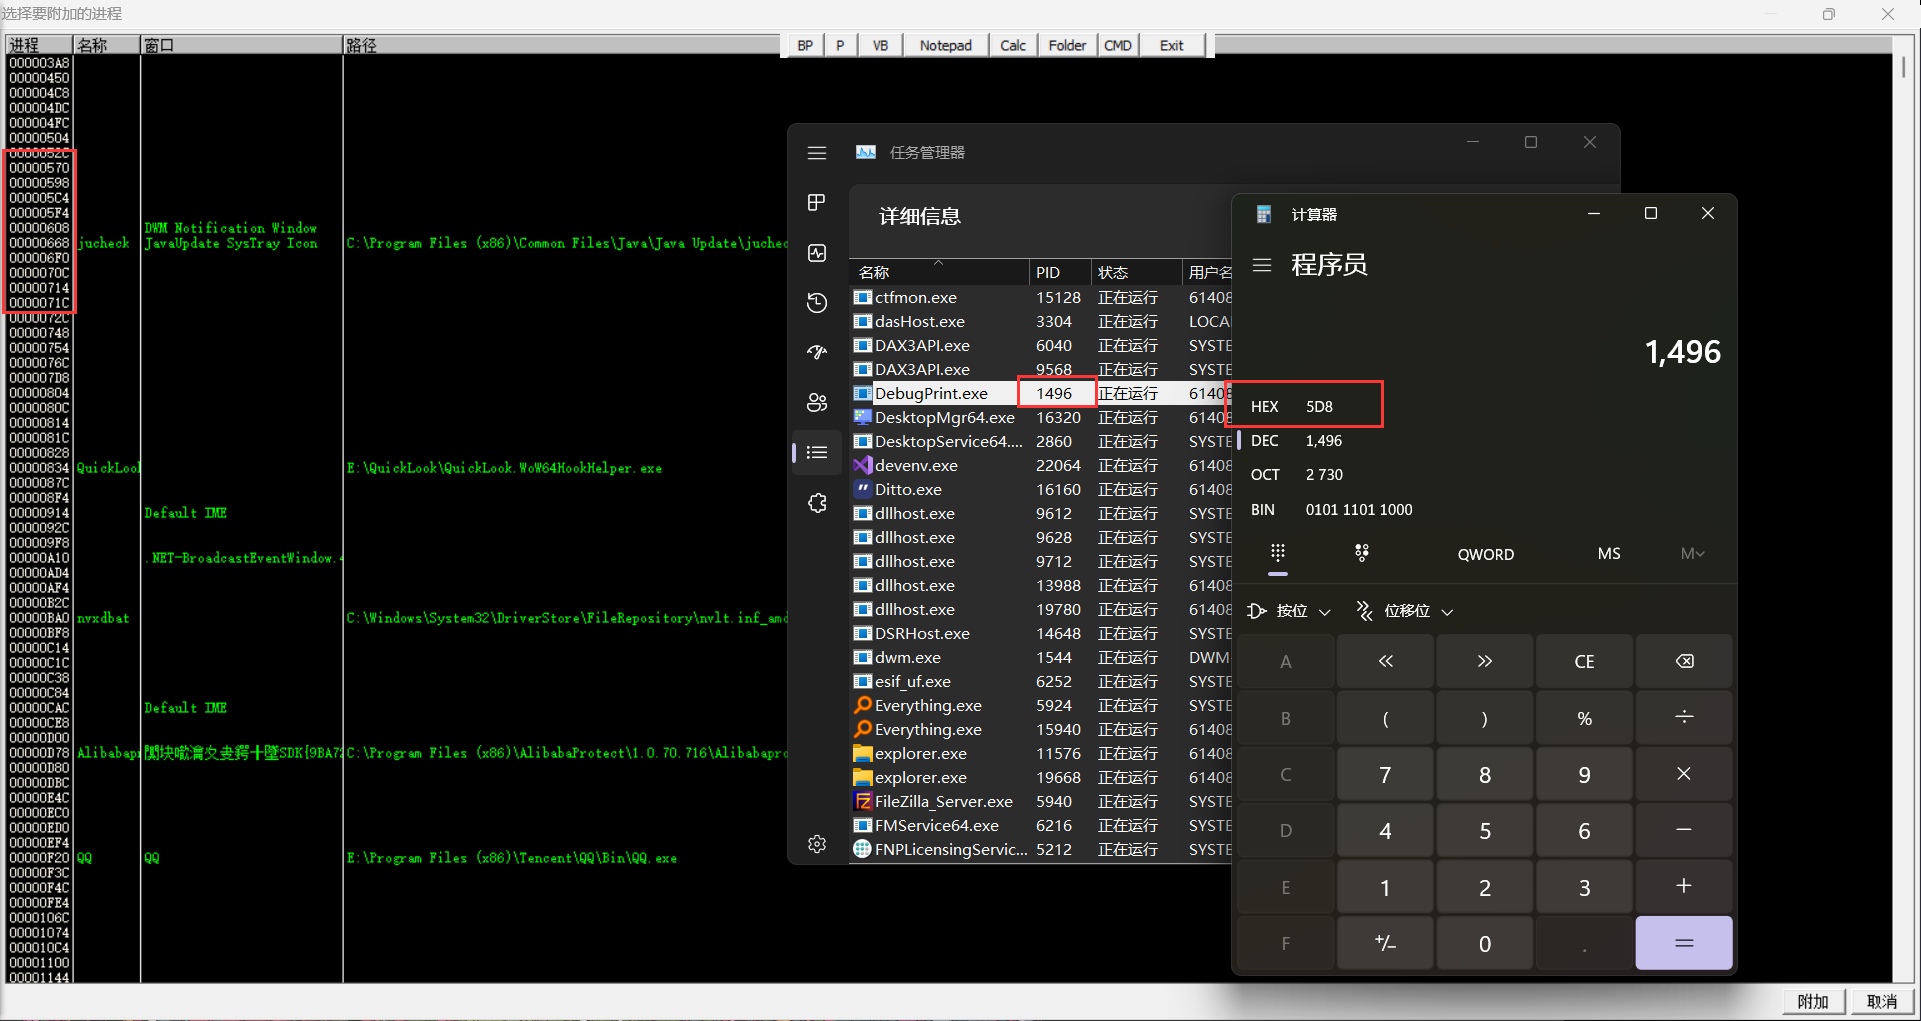
然后尝试使用od附加,这里可以看到是没有DebugPrint.exe这个进程的
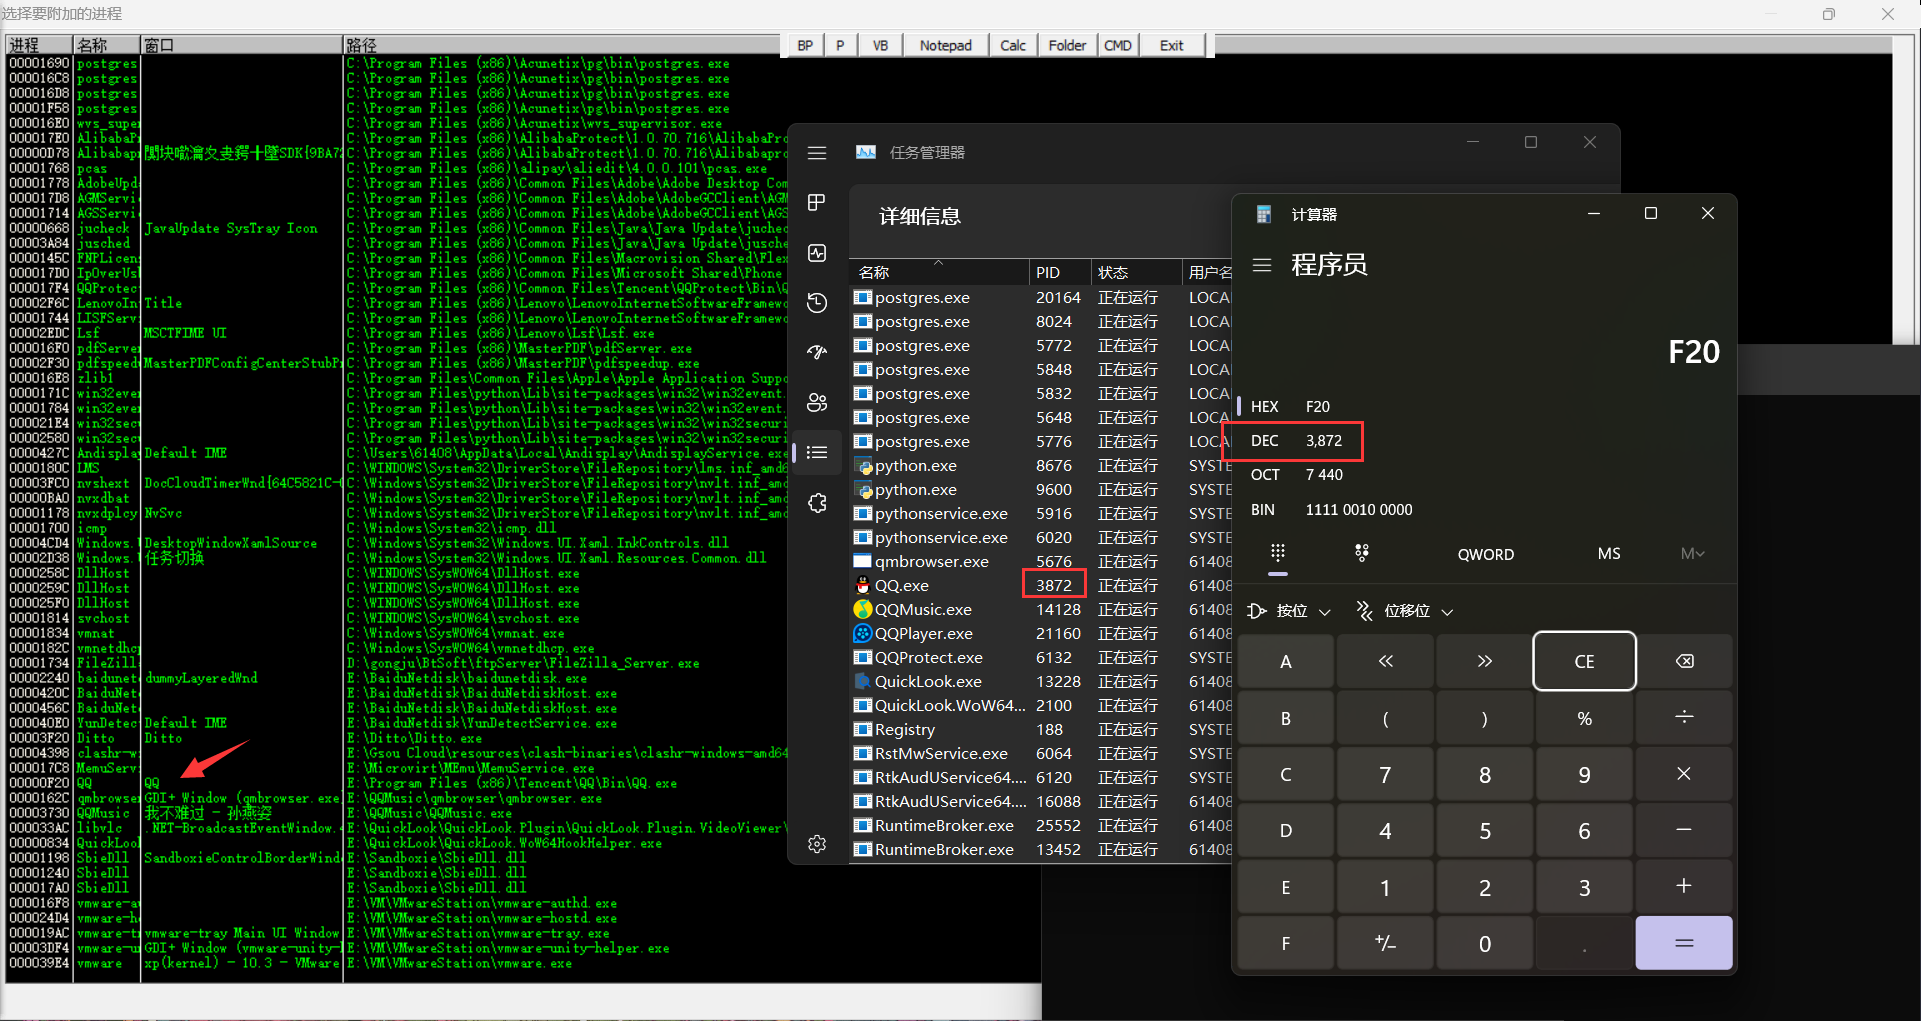
那么这里为了更明显一点,首先看下QQ的PID是3872对应十六进制为F20是能够对应上的
然后计算DebugPrint.exe的十六进制为5D8,在进程里面是看不到的
原理 我们在前面介绍了一些反调试的手段,基本上都是通过对内核的某个标志进行修改来达到反调试的效果,但是这里有一个问题就是,如果分析人员对我们的样本的API进行了hook,那么我们的反调试手段都将作废,也就是说我们还是要深入底层去探究调试器与被调试器直接究竟是如何建立连接的,只有了解了原理,我们才能更加得心应手的进行对抗
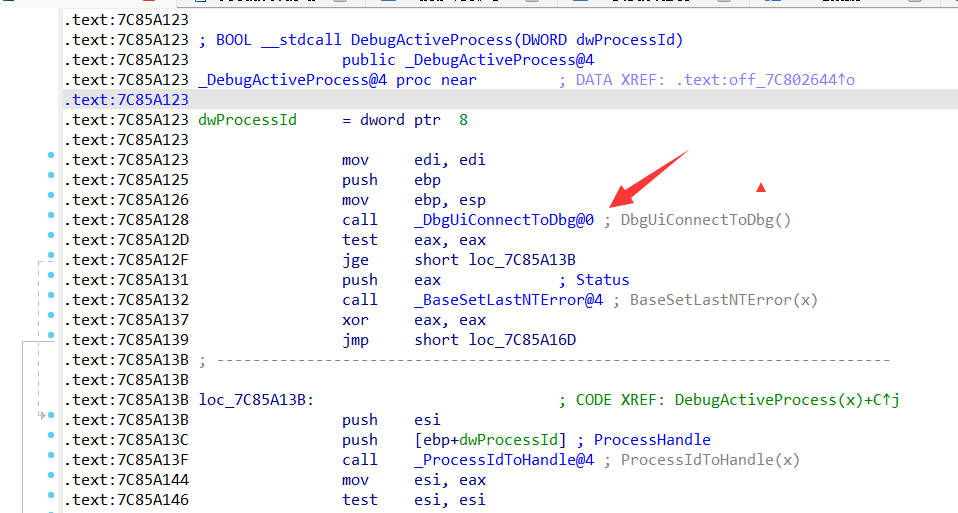
在windows里面,每个程序的低2G是独立使用的,高2G(内核)区域是共用的。那么我们假设一个场景,我们的3环调试器要想和被调试程序之间建立通信肯定就需要涉及到进程间的通信以及数据的交换,如果这个过程放在3环完成,不停的进程通信会很繁琐,所以windows选择将这个过程放在0环进行。调试器与被调试程序之间只能通过CreateProcess和DebugActiveProcess这两个API建立起连接,这里我们探究DebugActiveProcess是如何建立起两者之间的连接的
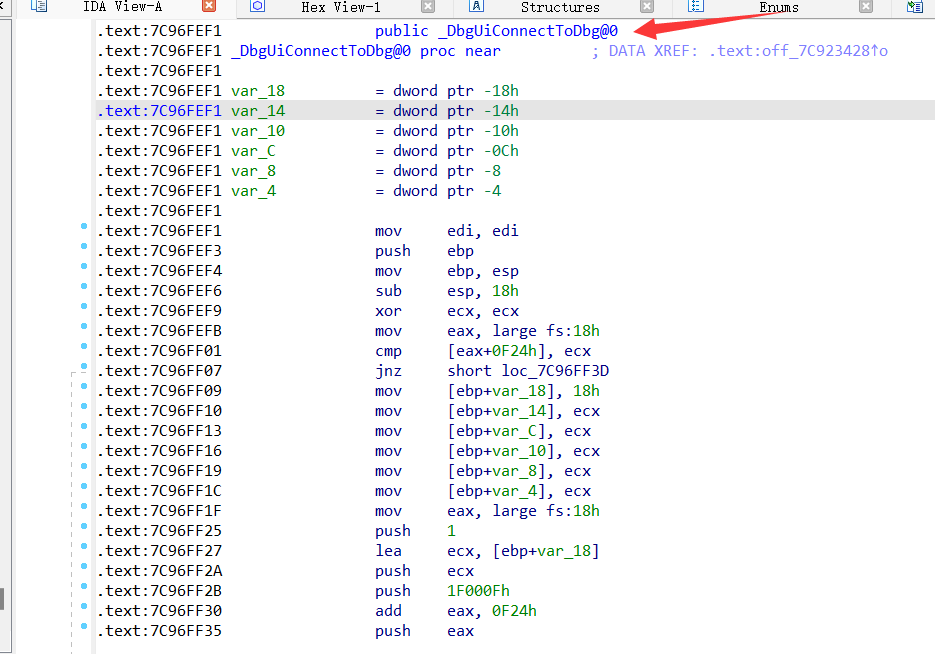
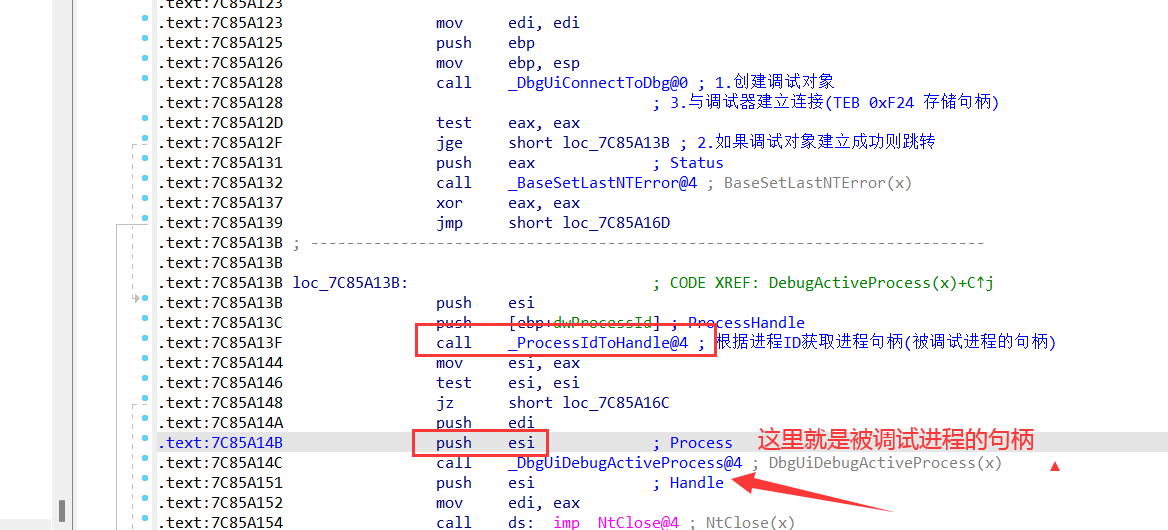
与调试器建立连接 首先看一下DebugActiveProcess
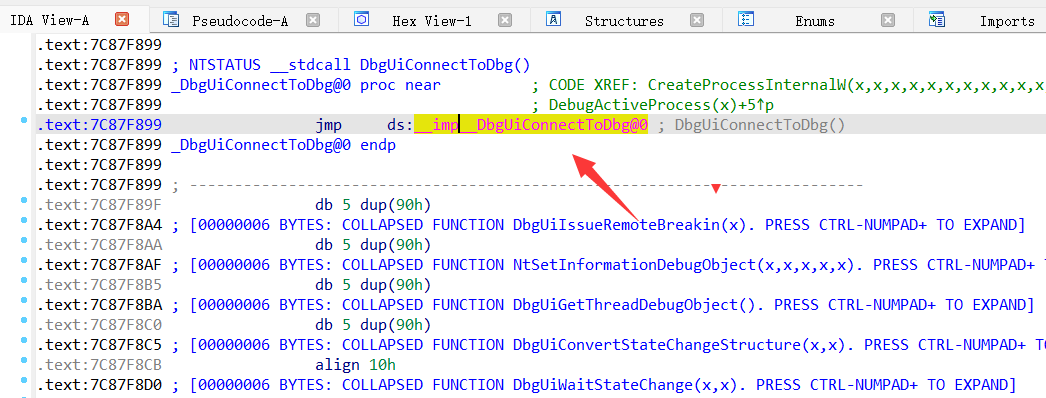
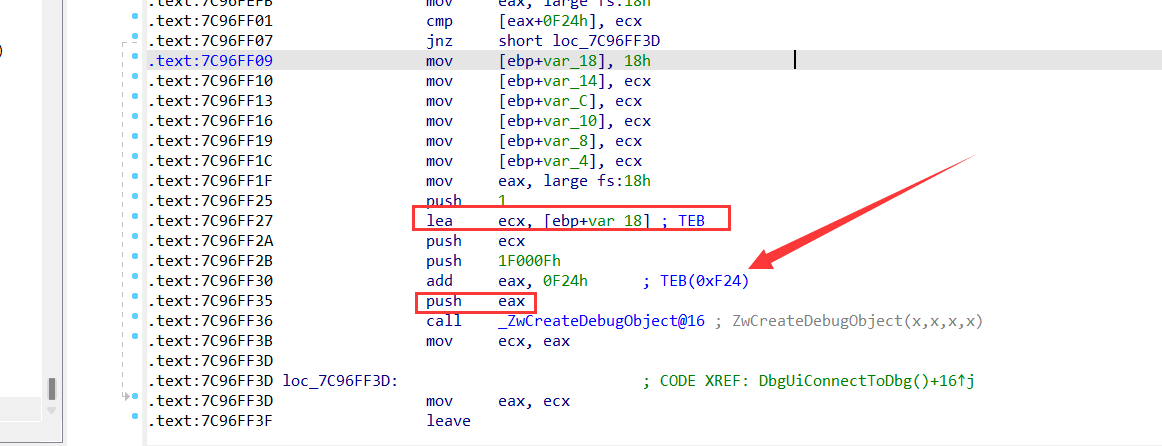
调用ntdll.dll的DbgUiConnectToDbg
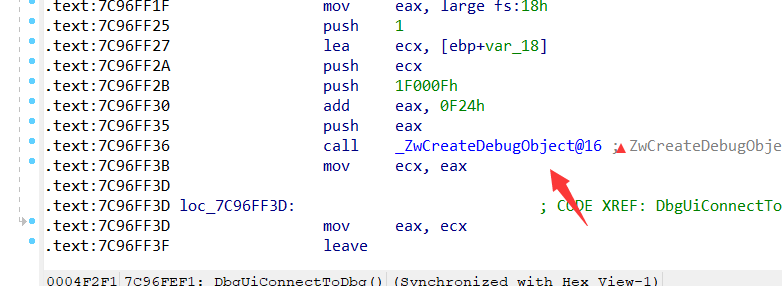
再调用ZwCreateDebugObject
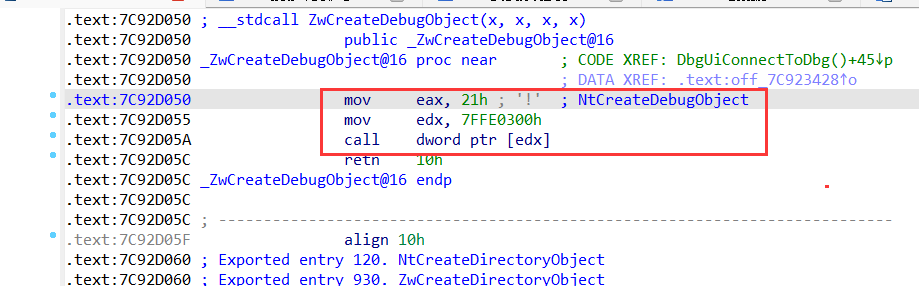
通过调用号进入0环
进入0环创建DEBUG_OBJECT结构体
1
2
3
4
5
6
typedef struct _DEBUG_OBJECT { KEVENT EventsPresent; FAST_MUTEX Mutex; LIST_ENTRY EventList; ULONG Flags; } DEBUG_OBJECT, *PDEBUG_OBJECT;
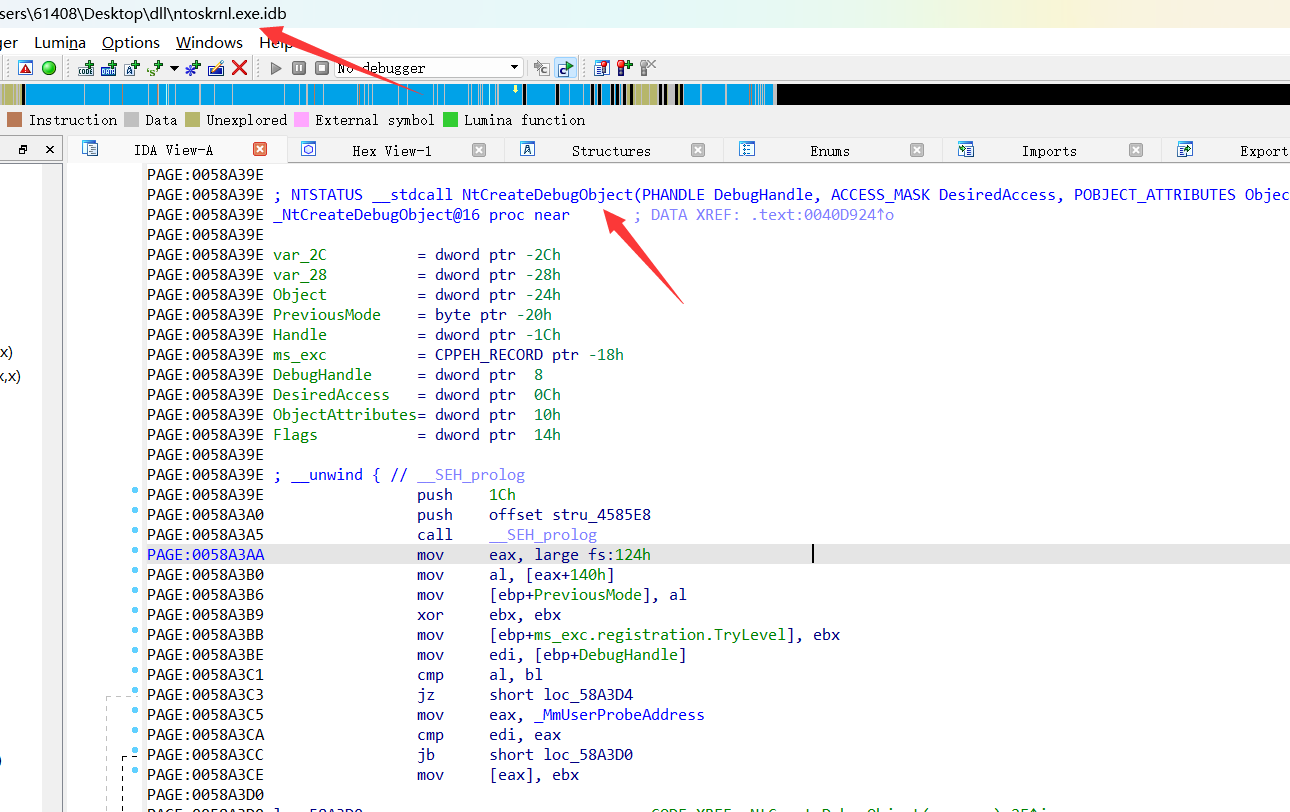
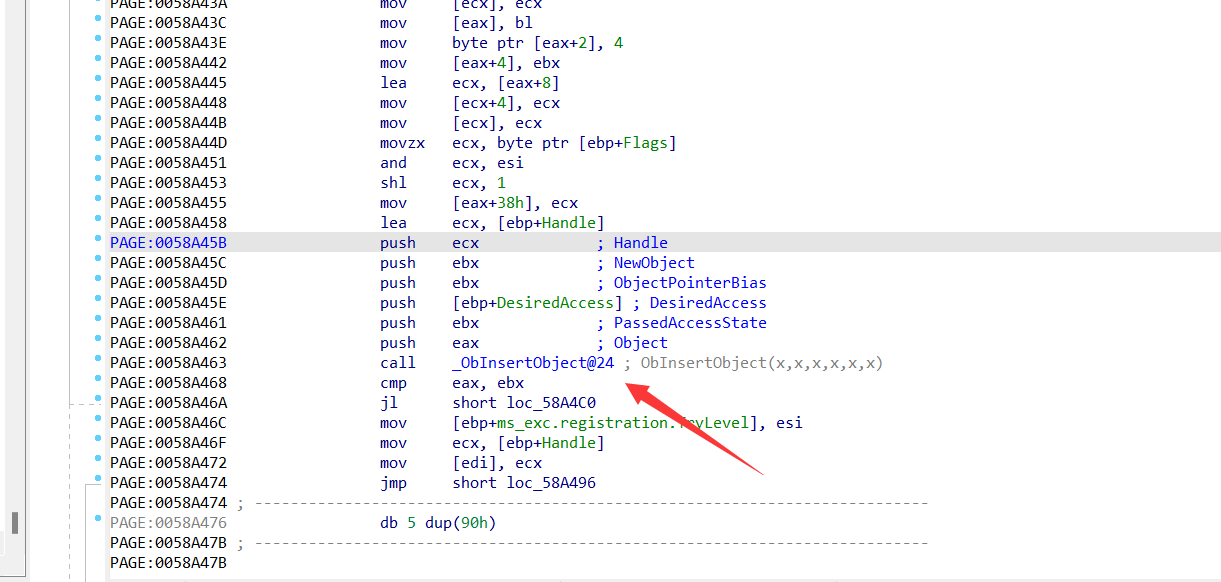
然后到ntoskrnl里面看一下NtCreateDebugObject
然后调用了ObInsertObject创建DebugObject结构返回句柄
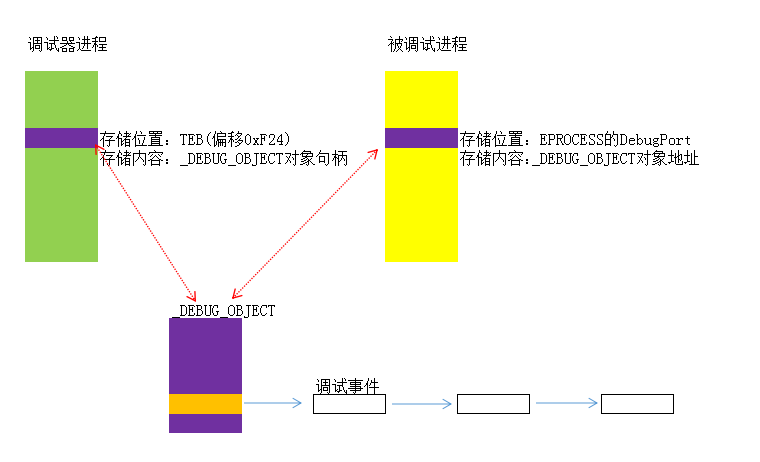
再回到ntdll.dll,当前线程回0环创建了一个DebugObject结构,返回句柄到3环存放在了TEB的0xF24偏移处
也就是说,遍历TEB的0xF24偏移的地方,如果有值则一定是调试器
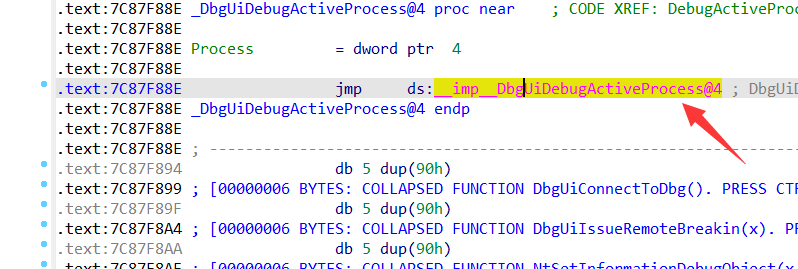
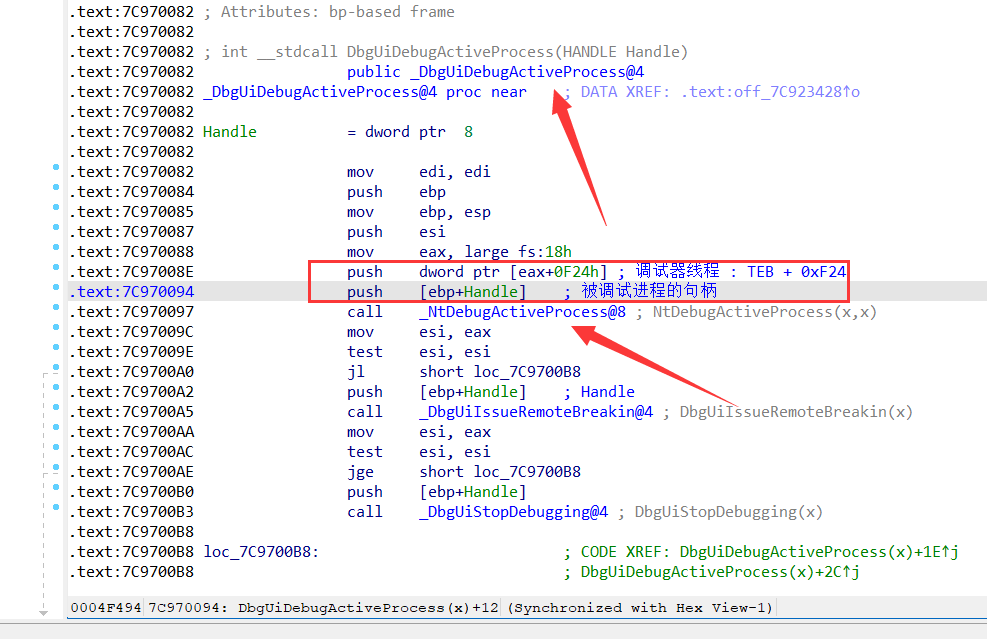
与被调试程序建立连接 还是回到kernel32.dll的DebugActiveProcess,获取句柄之后调用了DbgUiDebugActiveProcess
调用ntdll.dll的DbgUiDebugActiveProcess
跟到ntdll.dll里面的DbgUiDebugActiveProcess,传入两个参数,分别为调试器的句柄和被调试进程的句柄
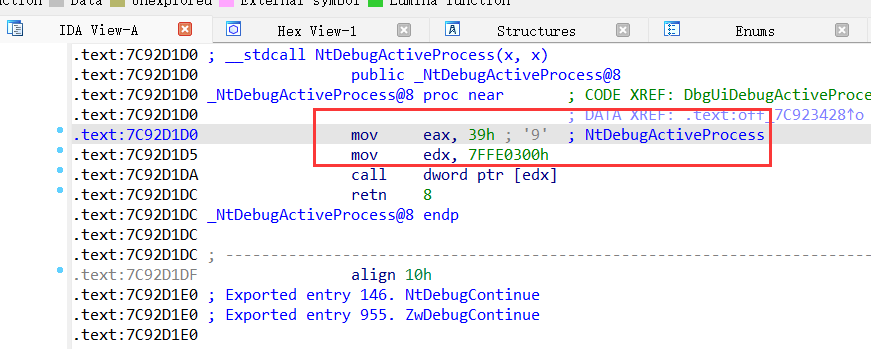
通过调用号进0环
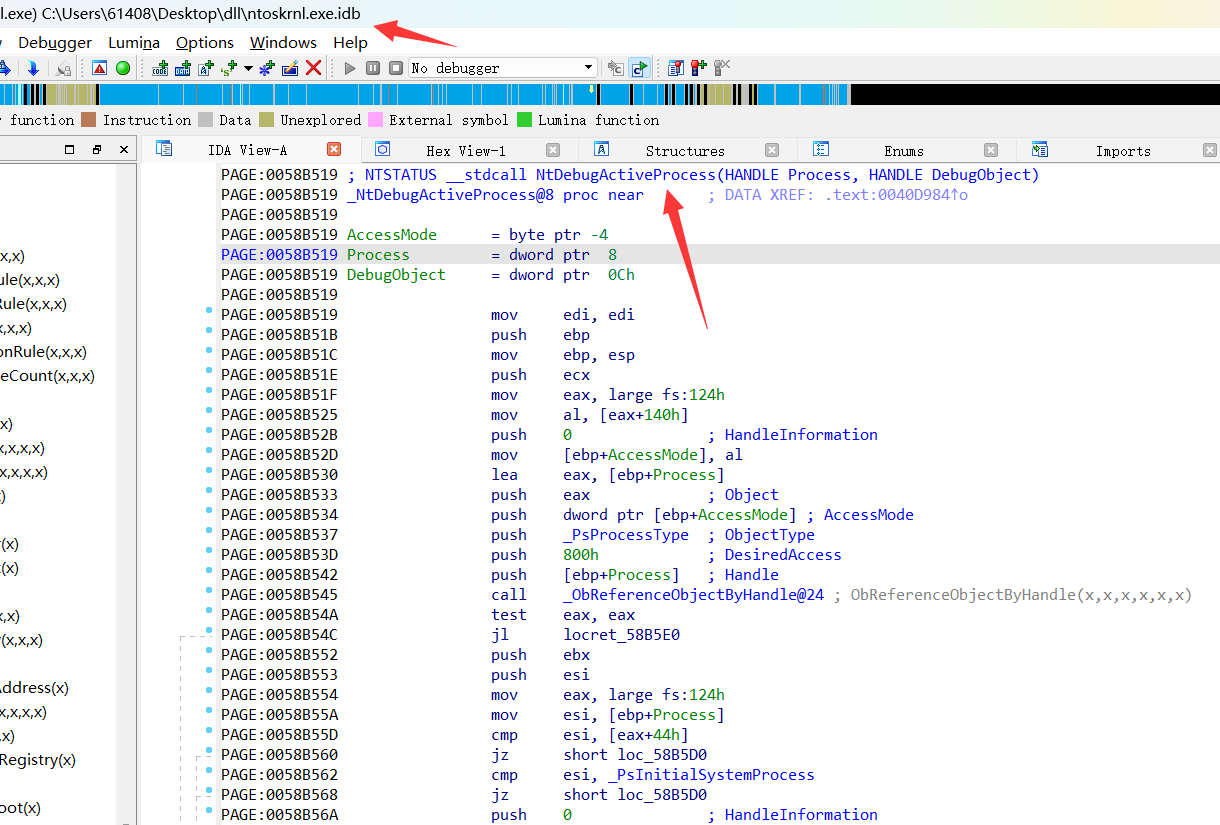
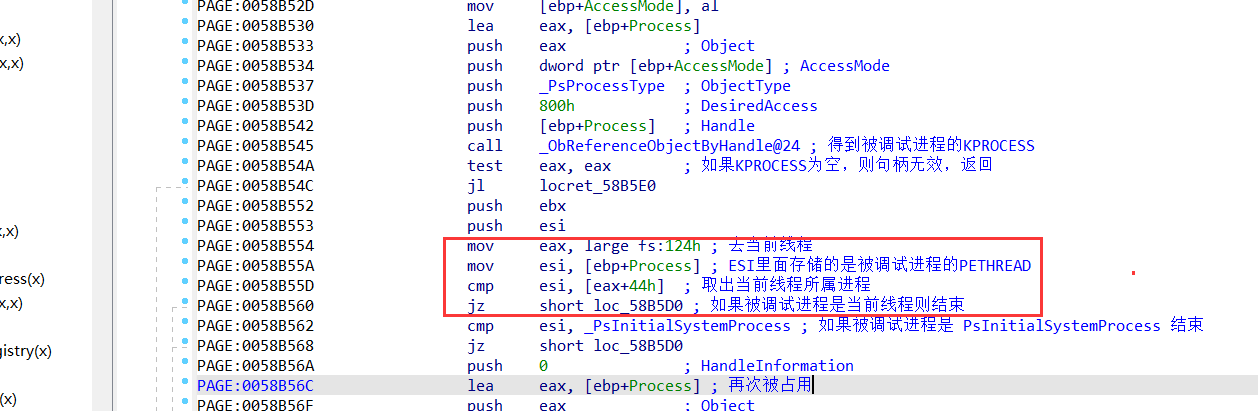
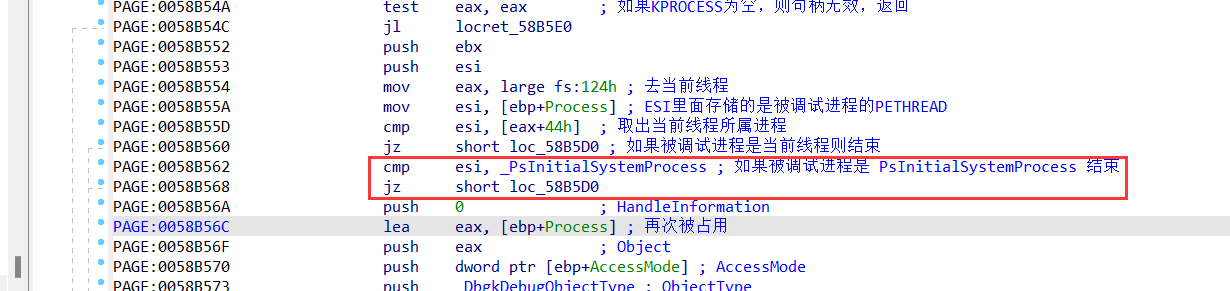
来到0环的NtDebugActiveProcess, 第一个参数为被调试对象的句柄,第二个参数为调试器的句柄
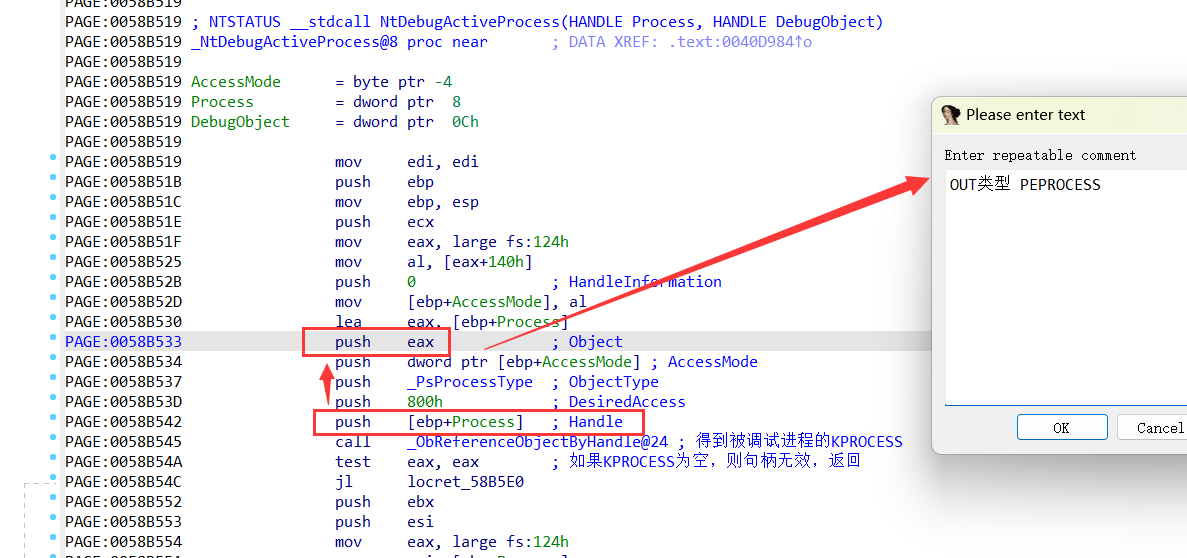
执行ObReferenceObjectByHandle,把被调试进程的句柄放到第五个参数里面,这里eax本来存储的是调试器的EPROCESS,执行完之后eax存储的就是被调试进程的EPROCESS
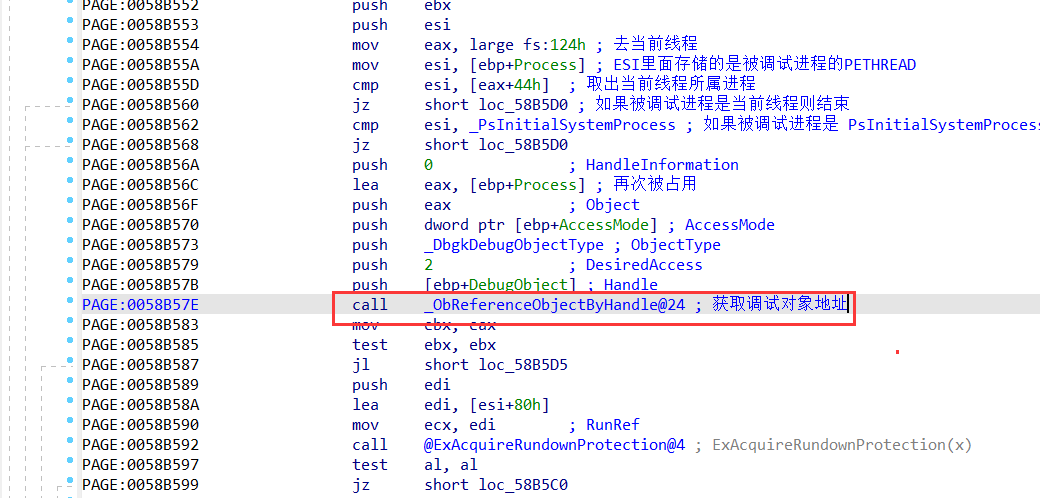
这里判断调试器打开的进程是否是自己,如果是自己则直接退出
也不能调试系统初始化的进程
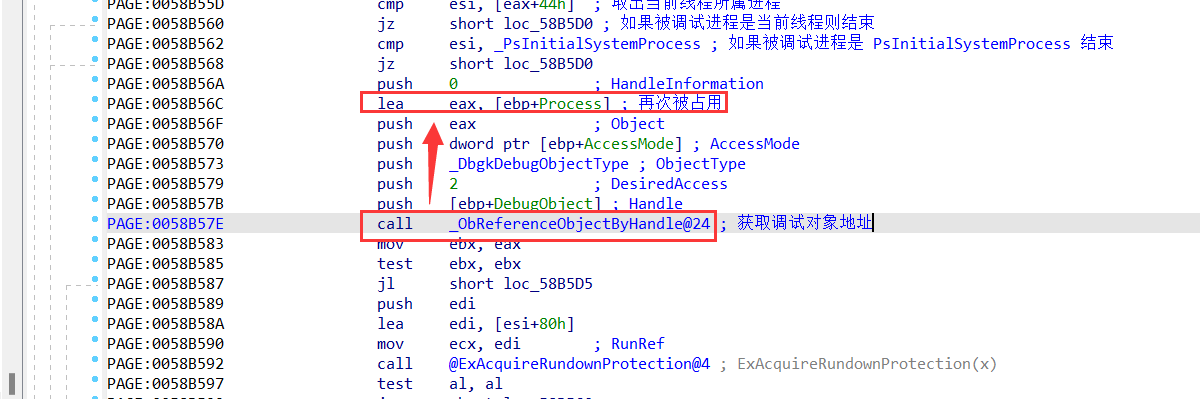
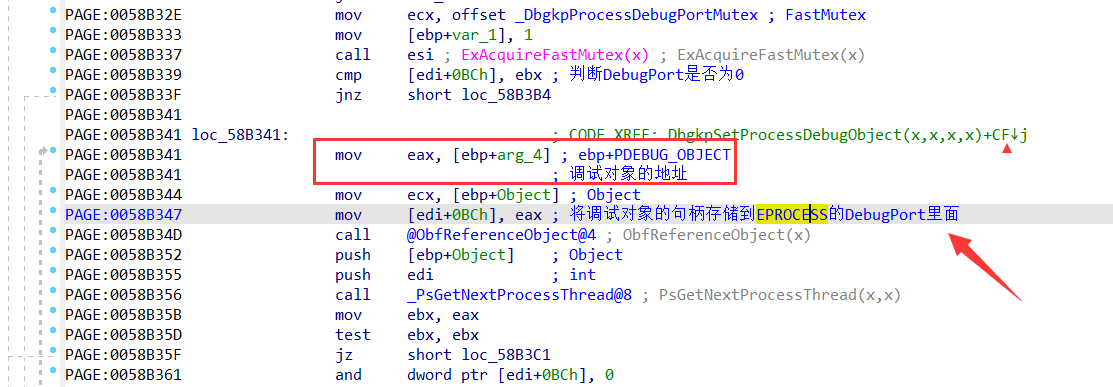
然后获取调试对象的地址,之前是句柄,但是句柄在0环里面是无效的,这里就要找真正的地址
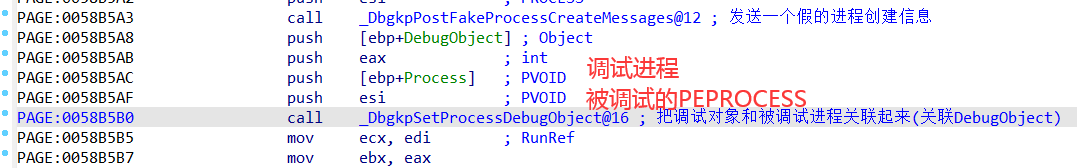
获取到调试对象的地址之后还是存到ebp+Process的地方,这里之前是被调试对象的地址,现在存储的是调试对象的地址
将调试进程和被调试的PEPROCESS传入_DbgkpSetProcessDebugObject,将调试对象和被调试进程关联起来
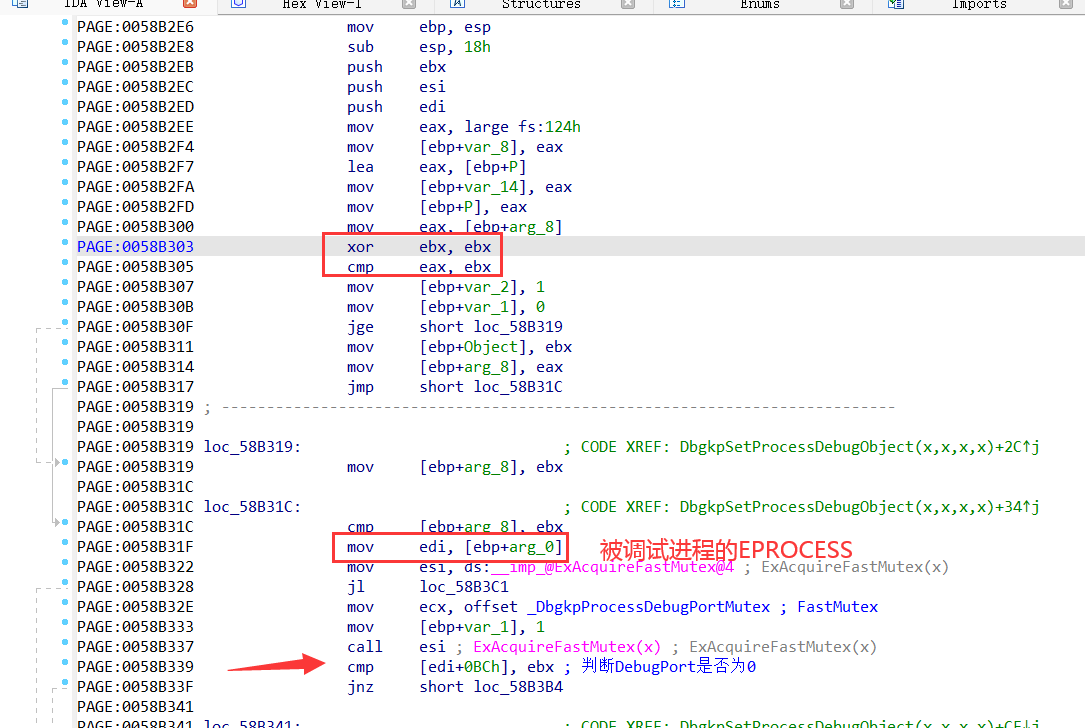
跟进函数,发现有判断DebugPort是否为0的操作,ebx为0,edi为被调试进程的EPROCESS,那么edi+0bc就是调试端口
然后再把调试对象的句柄放到被调试对象的DebugPort里面
调试事件 调试事件是在调试过程中导致系统通知调试器的事件,调试事件包括创建进程、创建线程、加载动态链接库 (DLL) 、卸载 DLL、发送输出字符串和生成异常。我们知道调试器和被调试程序的通信主要依赖于0环的_DEBUG_OBJECT结构,然后被调试程序在进行操作时(如:创建进程线程、加载dll)等,就会将一个调试事件写入到_DEBUG_OBJECT结构里面,调试器获得句柄即可进行调试
这里就会使用调试事件采集函数来对调试事件进行写入,调试器在被调试进程进行特定操作的必经之路中调试事件采集函数,必经之路分为5条,其中以Dbgk开头的函数为调试事件采集函数,所有调试事件采集函数最终都会调用DbgkpSendApiMessage将封装好的调试事件结构体写入到链表当中。DbgkSendApiMessage有两个参数,第一个参数为调试事件类型,第二个参数为是否挂起其它线程,有时需要,比如0xCC,有时不需要,比如模块加载。
例如创建进程、线程必经之路:
1
2
3
4
5
PspUserThreadStartup ()↓ DbgkCreateThread ()↓ DbgkpSendApiMessage ()
退出线程、进程必经之路:
1
2
3
4
5
PspExitThread ()↓ DbgkExitThread ()/DbgkExitProcess ()↓ DbgkpSendApiMessage ()
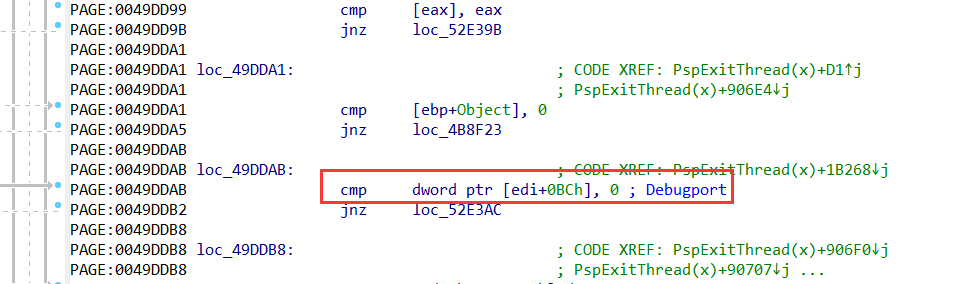
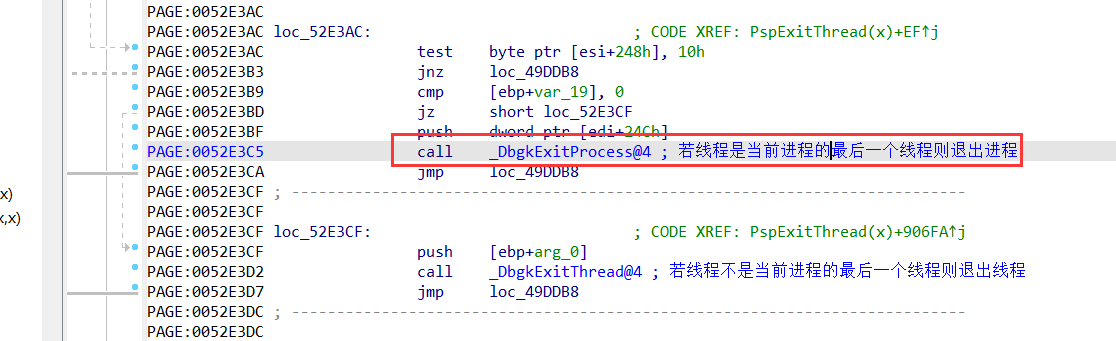
我们跟一下PspExitThread,首先在PspExitThread里面判断Debugport是否为0,如果为0则不处于调试状态就不会跳转,如果不为0则为调试状态则跳转到loc_52E3AC
然后这里有个判断,如果当前线程是最后一个线程则跳转到DbgkExitProcess退出进程,如果不是最后一个线程则跳转到DbgkExitThread退出当前线程
这里我们跟DbgkExitProcess,这里调用了DbgkpSendApiMessage,这个函数的作用就是将被调试程序发送过来的调试事件挂入_DEBUG_OBJECT
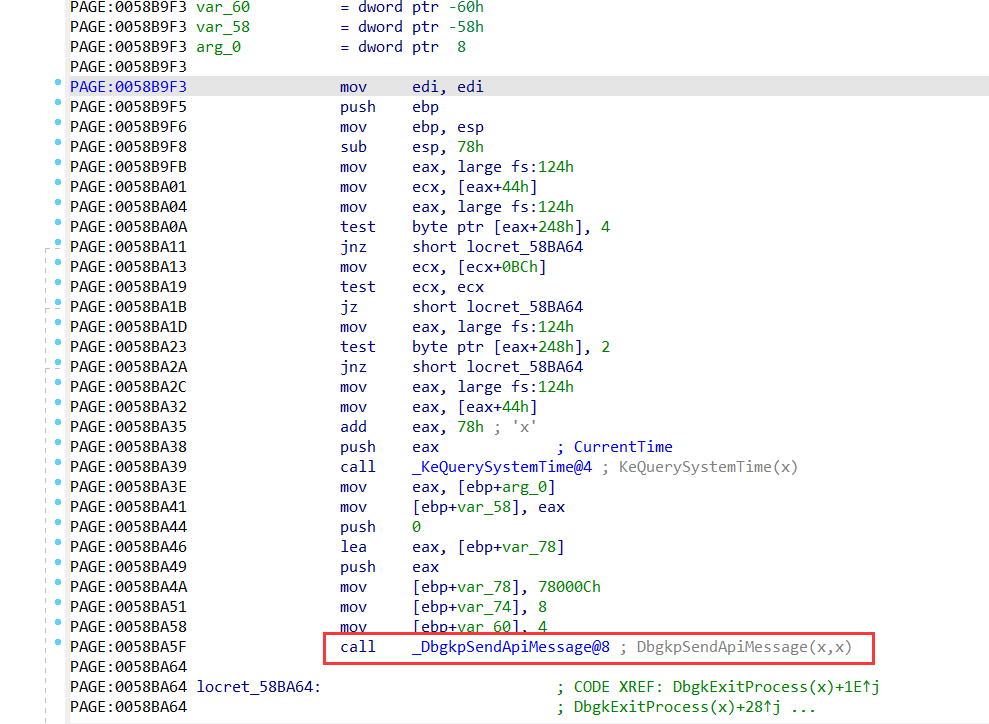
这里继续跟进去,如果不挂起进程则用DbgkpQueueMessage收集调试事件的有关信息
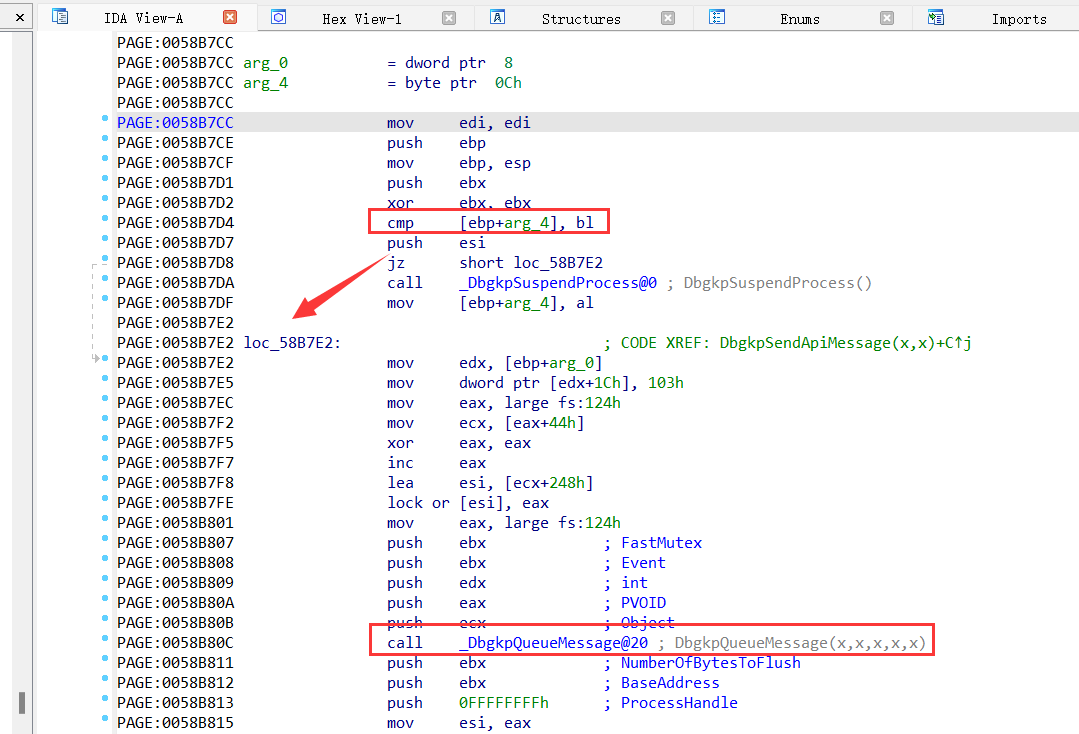
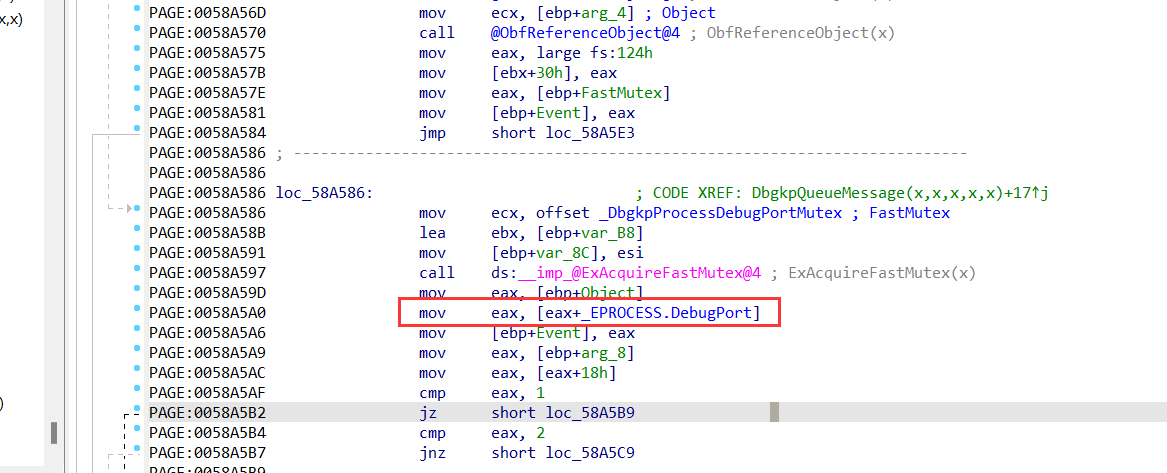
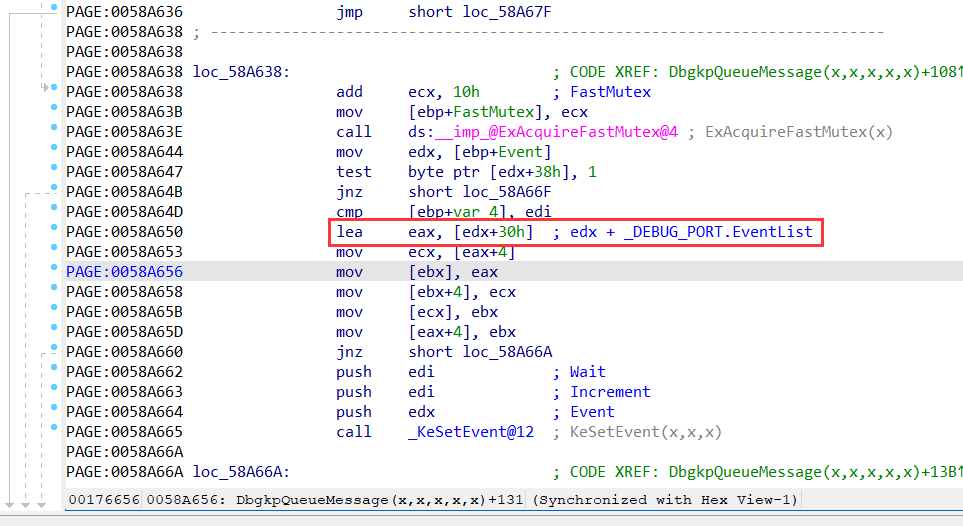
跟进DbgkpQueueMessage可以看到最终通过DebugPort得到被调试程序的_DEBUG_OBJECT的地址
这里继续往下走,通过链表操作添加调试事件信息
总结 首先调试器进程先创建一个_DEBUG_OBJECT结构放到TEB的0xF24处,存储的是_DEBUG_OBJECT结构的句柄,然后在被调试程序EPROCESS的DebugPort的地方存储_DEBUG_OBJECT结构的地址,然后通过调用DbgkpSendApiMessage进行调试事件的采集,把句柄放到_DEBUG_OBJECT结构,供调试器使用
那么了解了调试器和被调试器之间如何建立连接,我们就可以通过以下几种方式来进行反调试
1.不断将EPROCESS的DebugPort清零,使调试器不能够和被调试程序建立连接
2.遍历每个线程TEB的0xF24,如果存在值就证明有调试器
3.要想建立连接必须要在0环创建_DEBUG_OBJECT结构,使用NtCreateDebugObject,直接hook NtCreateDebugObject达到监控的效果
4.被调试进程必须通过DbgkpSendApiMessage将调试事件放入_DEBUG_OBJECT结构供调试器使用,那么这里就可以直接hook 对应的调试事件,如创建进程就hook DbgkCreateThread,也可以直接hook DbgkpSendApiMessage达到监控所有调试事件的效果